| Red | Green | Blue | |
| z | 17.64 | ||
| znorm | Inf | ||
| sky | -Inf | -Inf | -Inf |
| S/N | 24.0 | 42.5 | 47.5 |
| S/N(c) | 0.0 | 0.0 | 0.0 |
| SN(E/C) |
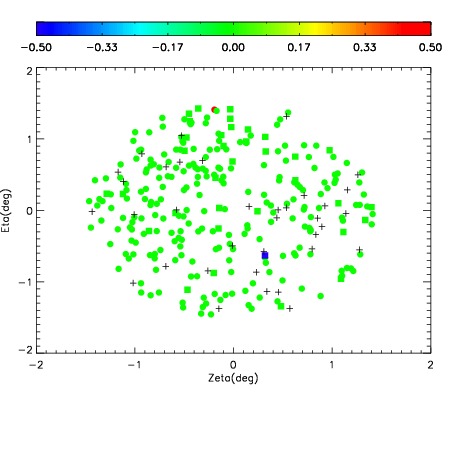
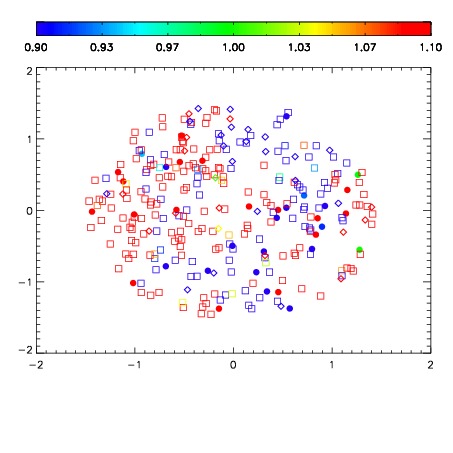
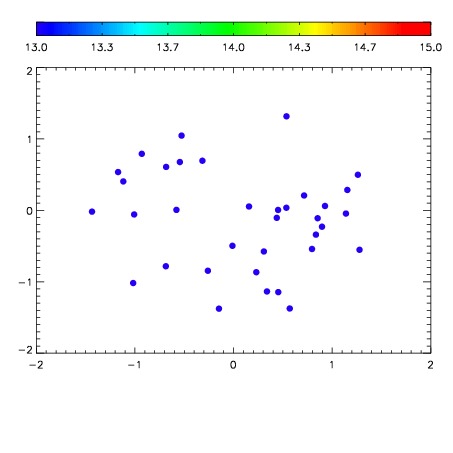

| Frame | Nreads | Zeropoints | Mag plots | Spatial mag deviation | Spatial sky 16325A emission deviations (filled: sky, open: star) | Spatial sky continuum emission | Spatial sky telluric CO2 absorption deviations (filled: H < 10) | |||||||||||||||||||||||
| 0 | 0 |
|
|
|
|
|
|
| IPAIR | NAME | SHIFT | NEWSHIFT | S/N | NAME | SHIFT | NEWSHIFT | S/N |
| 0 | 02780046 | 0.420542 | 0.00000 | 214.896 | 02780044 | -0.00207082 | 0.422613 | 211.699 |
| 1 | 02780045 | 0.418142 | 0.00240001 | 214.266 | 02780047 | 0.00696349 | 0.413579 | 187.489 |
| 2 | 02780041 | 0.418225 | 0.00231701 | 191.445 | 02780043 | 0.00772536 | 0.412817 | 185.390 |
| 3 | 02780042 | 0.420243 | 0.000299007 | 188.411 | 02780040 | 0.00000 | 0.420542 | 176.270 |