| Red | Green | Blue | |
| z | 17.64 | ||
| znorm | Inf | ||
| sky | -Inf | -NaN | -Inf |
| S/N | 21.8 | 38.9 | 41.3 |
| S/N(c) | 0.0 | 0.0 | 0.0 |
| SN(E/C) |
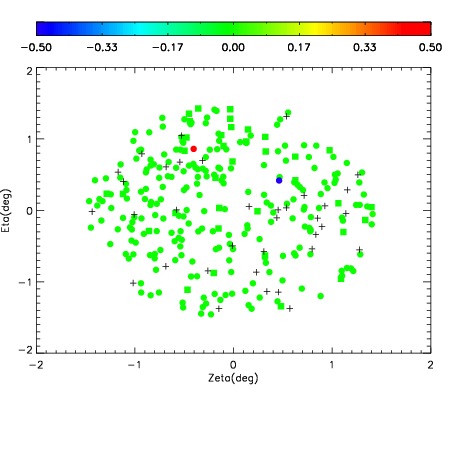
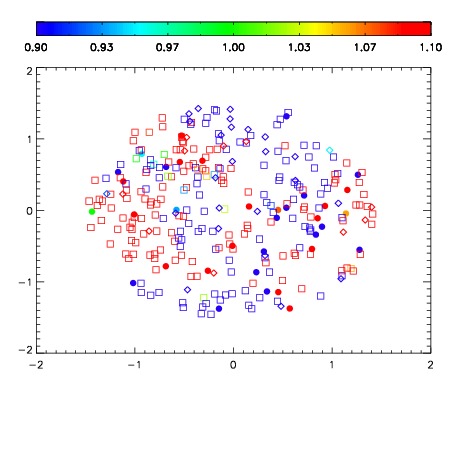
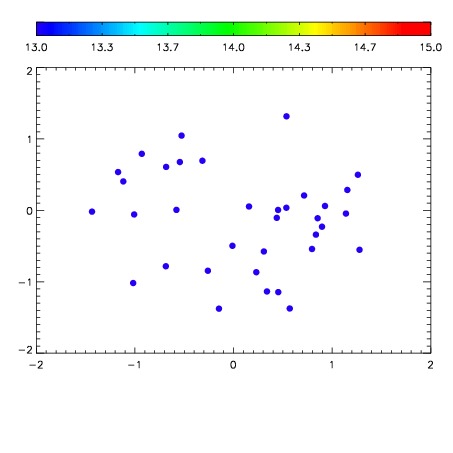

| Frame | Nreads | Zeropoints | Mag plots | Spatial mag deviation | Spatial sky 16325A emission deviations (filled: sky, open: star) | Spatial sky continuum emission | Spatial sky telluric CO2 absorption deviations (filled: H < 10) | |||||||||||||||||||||||
| 0 | 0 |
|
|
|
|
|
|
| IPAIR | NAME | SHIFT | NEWSHIFT | S/N | NAME | SHIFT | NEWSHIFT | S/N |
| 0 | 06630021 | 0.476160 | 0.00000 | 178.405 | 06630018 | -0.00161217 | 0.477772 | 172.224 |
| 1 | 06630020 | 0.476024 | 0.000135988 | 183.033 | 06630022 | -0.00344423 | 0.479604 | 179.779 |
| 2 | 06630016 | 0.475752 | 0.000407994 | 181.196 | 06630019 | -0.00323878 | 0.479399 | 177.639 |
| 3 | 06630017 | 0.475896 | 0.000263989 | 175.437 | 06630015 | 0.00000 | 0.476160 | 164.793 |