| Red | Green | Blue | |
| z | 17.64 | ||
| znorm | Inf | ||
| sky | -Inf | -Inf | -Inf |
| S/N | 29.4 | 48.5 | 53.7 |
| S/N(c) | 0.0 | 0.0 | 0.0 |
| SN(E/C) |

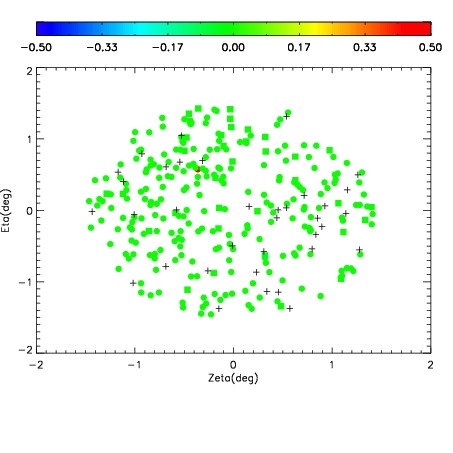
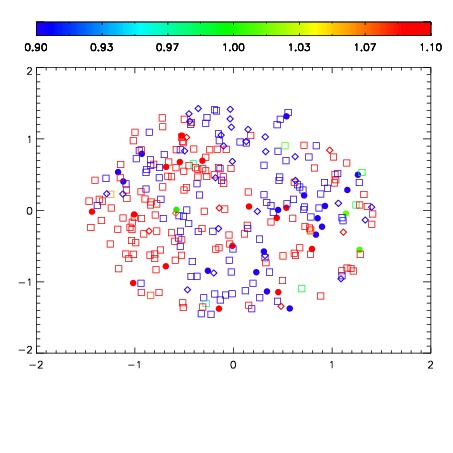


| Frame | Nreads | Zeropoints | Mag plots | Spatial mag deviation | Spatial sky 16325A emission deviations (filled: sky, open: star) | Spatial sky continuum emission | Spatial sky telluric CO2 absorption deviations (filled: H < 10) | |||||||||||||||||||||||
| 0 | 0 |
|
|
|
|
|
|
| IPAIR | NAME | SHIFT | NEWSHIFT | S/N | NAME | SHIFT | NEWSHIFT | S/N |
| 0 | 06670028 | 0.476074 | 0.00000 | 210.723 | 06670033 | 0.00320704 | 0.472867 | 206.959 |
| 1 | 06670032 | 0.475704 | 0.000369996 | 207.018 | 06670026 | 0.00000 | 0.476074 | 205.623 |
| 2 | 06670027 | 0.475270 | 0.000804007 | 205.249 | 06670030 | 0.000944859 | 0.475129 | 205.585 |
| 3 | 06670031 | 0.475654 | 0.000420004 | 203.814 | 06670029 | 0.00305571 | 0.473018 | 199.491 |