| Red | Green | Blue | |
| z | 17.64 | ||
| znorm | Inf | ||
| sky | -Inf | -NaN | -Inf |
| S/N | 28.0 | 45.3 | 50.5 |
| S/N(c) | 0.0 | 0.0 | 0.0 |
| SN(E/C) |
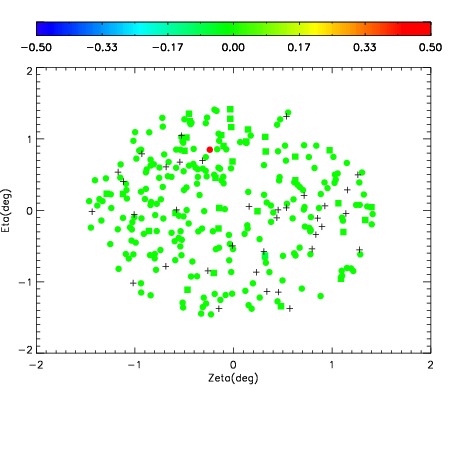
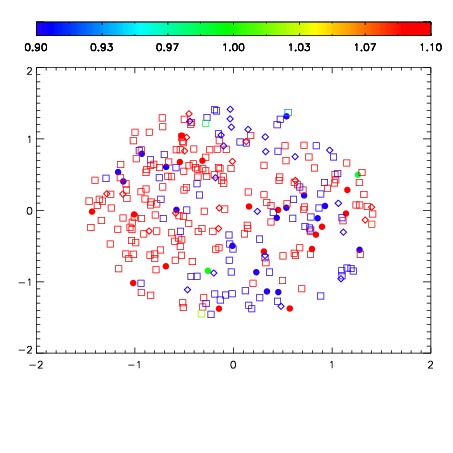
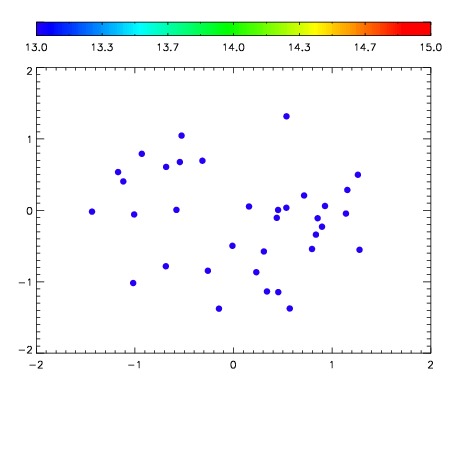

| Frame | Nreads | Zeropoints | Mag plots | Spatial mag deviation | Spatial sky 16325A emission deviations (filled: sky, open: star) | Spatial sky continuum emission | Spatial sky telluric CO2 absorption deviations (filled: H < 10) | |||||||||||||||||||||||
| 0 | 0 |
|
|
|
|
|
|
| IPAIR | NAME | SHIFT | NEWSHIFT | S/N | NAME | SHIFT | NEWSHIFT | S/N |
| 0 | 06900013 | 0.492922 | 0.00000 | 186.078 | 06900015 | -0.000564908 | 0.493487 | 185.289 |
| 1 | 06900017 | 0.492108 | 0.000814021 | 204.389 | 06900011 | 0.00000 | 0.492922 | 198.595 |
| 2 | 06900012 | 0.492183 | 0.000739008 | 201.909 | 06900014 | 0.000276584 | 0.492645 | 196.927 |
| 3 | 06900016 | 0.492168 | 0.000753999 | 199.334 | 06900018 | -0.000365747 | 0.493288 | 191.931 |