| Red | Green | Blue | |
| z | 17.64 | ||
| znorm | Inf | ||
| sky | -Inf | -Inf | -Inf |
| S/N | 29.5 | 47.4 | 49.0 |
| S/N(c) | 0.0 | 0.0 | 0.0 |
| SN(E/C) |
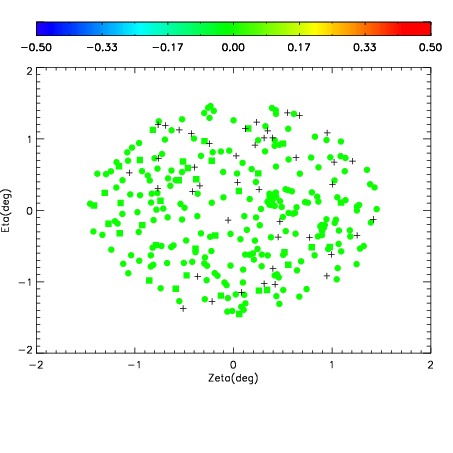
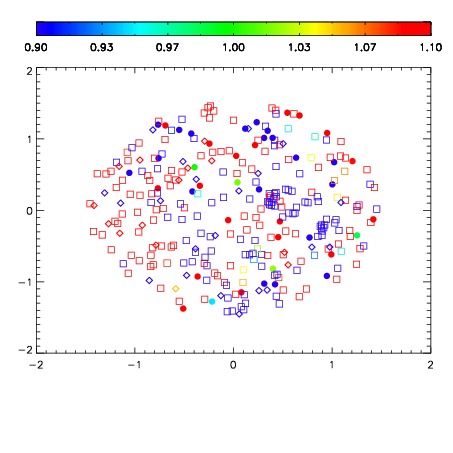


| Frame | Nreads | Zeropoints | Mag plots | Spatial mag deviation | Spatial sky 16325A emission deviations (filled: sky, open: star) | Spatial sky continuum emission | Spatial sky telluric CO2 absorption deviations (filled: H < 10) | |||||||||||||||||||||||
| 0 | 0 |
|
|
|
|
|
|
| IPAIR | NAME | SHIFT | NEWSHIFT | S/N | NAME | SHIFT | NEWSHIFT | S/N |
| 0 | 06430016 | 0.485468 | 0.00000 | 191.040 | 06430013 | 0.000157530 | 0.485310 | 186.281 |
| 1 | 06430015 | 0.485209 | 0.000259012 | 193.665 | 06430014 | -0.000810271 | 0.486278 | 194.757 |
| 2 | 06430011 | 0.483284 | 0.00218400 | 191.125 | 06430010 | 0.00000 | 0.485468 | 191.987 |
| 3 | 06430012 | 0.483961 | 0.00150701 | 191.063 | 06430017 | 0.00225223 | 0.483216 | 191.267 |