| Red | Green | Blue | |
| z | 17.64 | ||
| znorm | Inf | ||
| sky | -Inf | -Inf | -Inf |
| S/N | 30.3 | 49.5 | 53.5 |
| S/N(c) | 0.0 | 0.0 | 0.0 |
| SN(E/C) |
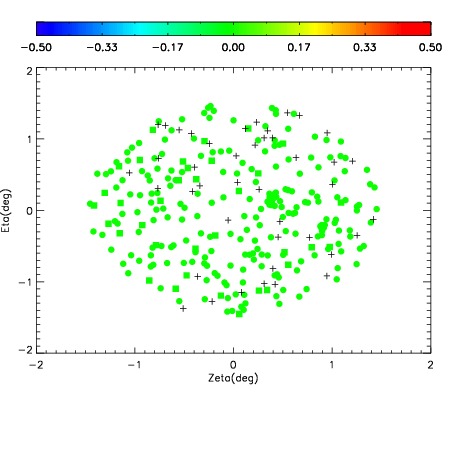
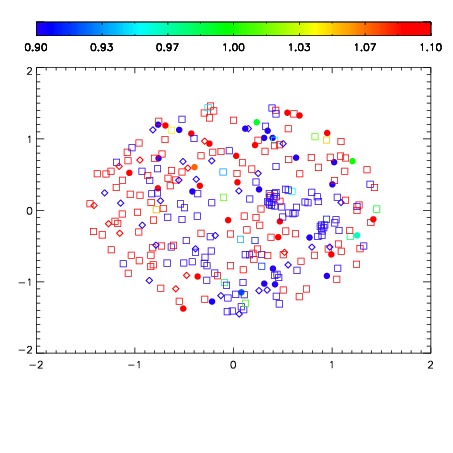
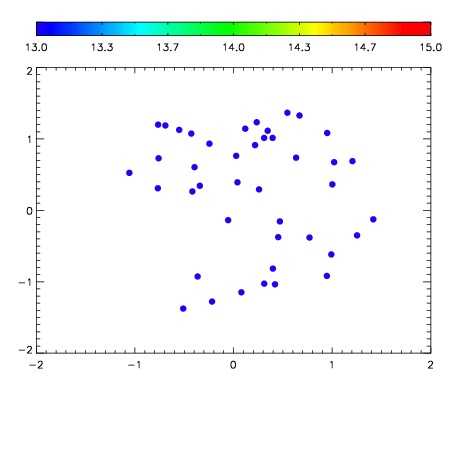

| Frame | Nreads | Zeropoints | Mag plots | Spatial mag deviation | Spatial sky 16325A emission deviations (filled: sky, open: star) | Spatial sky continuum emission | Spatial sky telluric CO2 absorption deviations (filled: H < 10) | |||||||||||||||||||||||
| 0 | 0 |
|
|
|
|
|
|
| IPAIR | NAME | SHIFT | NEWSHIFT | S/N | NAME | SHIFT | NEWSHIFT | S/N |
| 0 | 06590031 | 0.473329 | 0.00000 | 193.012 | 06590032 | 0.00575628 | 0.467573 | 188.962 |
| 1 | 06590027 | 0.471514 | 0.00181502 | 202.586 | 06590028 | 0.00395541 | 0.469374 | 200.763 |
| 2 | 06590026 | 0.470912 | 0.00241700 | 201.166 | 06590029 | 0.00243141 | 0.470898 | 199.748 |
| 3 | 06590030 | 0.473029 | 0.000300020 | 198.217 | 06590025 | 0.00000 | 0.473329 | 199.701 |