| Red | Green | Blue | |
| z | 17.63 | ||
| znorm | Inf | ||
| sky | -NaN | -NaN | -Inf |
| S/N | 30.5 | 49.2 | 51.0 |
| S/N(c) | 0.0 | 0.0 | 0.0 |
| SN(E/C) |
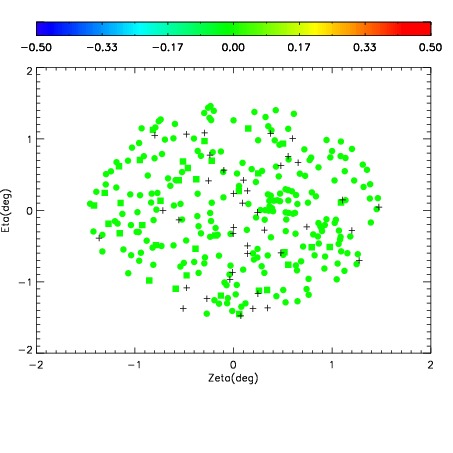
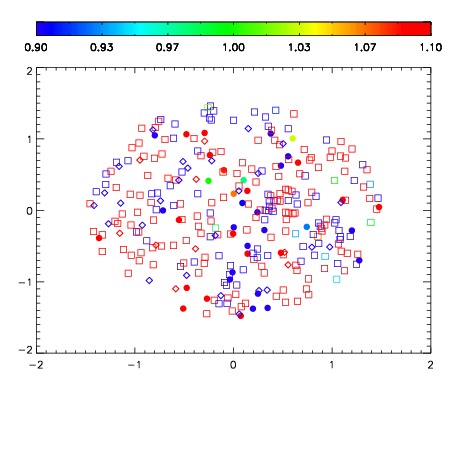
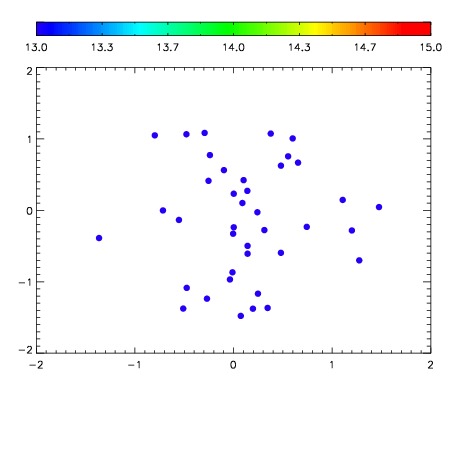

| Frame | Nreads | Zeropoints | Mag plots | Spatial mag deviation | Spatial sky 16325A emission deviations (filled: sky, open: star) | Spatial sky continuum emission | Spatial sky telluric CO2 absorption deviations (filled: H < 10) | |||||||||||||||||||||||
| 0 | 0 |
|
|
|
|
|
|
| IPAIR | NAME | SHIFT | NEWSHIFT | S/N | NAME | SHIFT | NEWSHIFT | S/N |
| 0 | 06610030 | 0.470688 | 0.00000 | 221.355 | 06610032 | -0.00543725 | 0.476125 | 221.572 |
| 1 | 06610026 | 0.465483 | 0.00520498 | 225.876 | 06610025 | 0.00000 | 0.470688 | 226.607 |
| 2 | 06610031 | 0.470020 | 0.000667989 | 225.120 | 06610028 | -0.00427099 | 0.474959 | 224.688 |
| 3 | 06610027 | 0.465462 | 0.00522599 | 224.257 | 06610029 | -0.00516309 | 0.475851 | 223.286 |