| Red | Green | Blue | |
| z | 17.64 | ||
| znorm | Inf | ||
| sky | -Inf | -Inf | -Inf |
| S/N | 17.5 | 31.9 | 32.9 |
| S/N(c) | 0.0 | 0.0 | 0.0 |
| SN(E/C) |
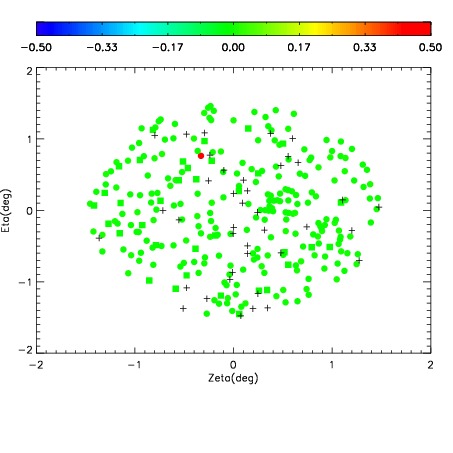

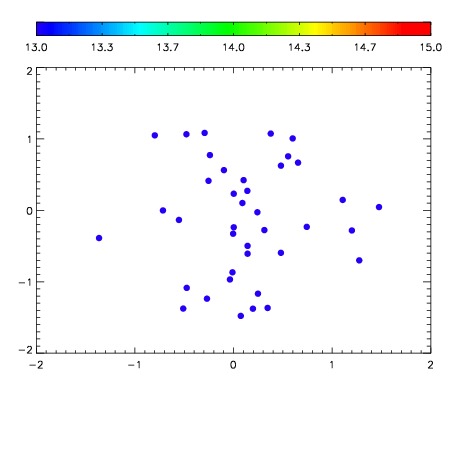

| Frame | Nreads | Zeropoints | Mag plots | Spatial mag deviation | Spatial sky 16325A emission deviations (filled: sky, open: star) | Spatial sky continuum emission | Spatial sky telluric CO2 absorption deviations (filled: H < 10) | |||||||||||||||||||||||
| 0 | 0 |
|
|
|
|
|
|
| IPAIR | NAME | SHIFT | NEWSHIFT | S/N | NAME | SHIFT | NEWSHIFT | S/N |
| 0 | 06650028 | 0.488702 | 0.00000 | 163.464 | 06650029 | 0.00606306 | 0.482639 | 154.198 |
| 1 | 06650027 | 0.488455 | 0.000247002 | 166.797 | 06650026 | 0.00000 | 0.488702 | 177.826 |
| 2 | 06650031 | 0.487501 | 0.00120100 | 160.157 | 06650030 | 0.00615065 | 0.482551 | 151.457 |
| 3 | 06650032 | 0.488501 | 0.000200987 | 130.313 | 06650033 | 0.00373618 | 0.484966 | 139.039 |