| Red | Green | Blue | |
| z | 17.64 | ||
| znorm | Inf | ||
| sky | -Inf | -NaN | -Inf |
| S/N | 16.1 | 30.5 | 32.7 |
| S/N(c) | 0.0 | 0.0 | 0.0 |
| SN(E/C) |
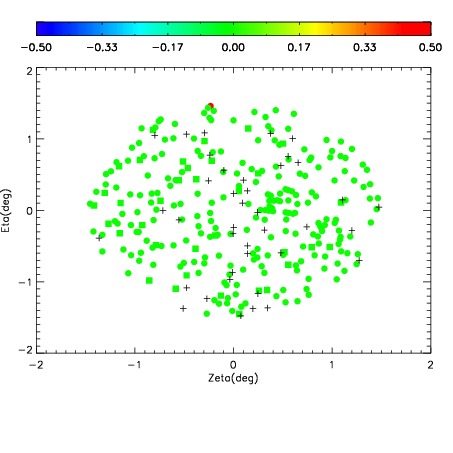
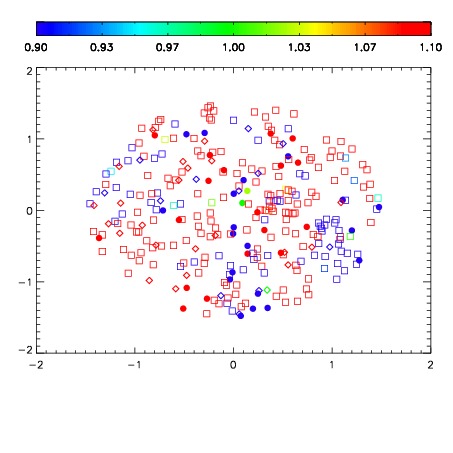
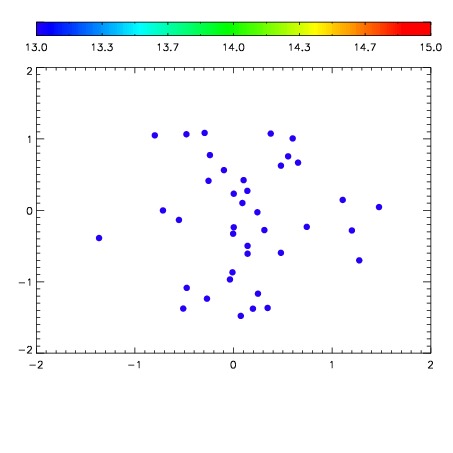

| Frame | Nreads | Zeropoints | Mag plots | Spatial mag deviation | Spatial sky 16325A emission deviations (filled: sky, open: star) | Spatial sky continuum emission | Spatial sky telluric CO2 absorption deviations (filled: H < 10) | |||||||||||||||||||||||
| 0 | 0 |
|
|
|
|
|
|
| IPAIR | NAME | SHIFT | NEWSHIFT | S/N | NAME | SHIFT | NEWSHIFT | S/N |
| 0 | 06890017 | 0.499193 | 0.00000 | 172.748 | 06890015 | -0.000156827 | 0.499350 | 163.586 |
| 1 | 06890013 | 0.495995 | 0.00319803 | 198.775 | 06890018 | 0.00255449 | 0.496639 | 172.854 |
| 2 | 06890016 | 0.497864 | 0.00132900 | 179.926 | 06890014 | 0.00160872 | 0.497584 | 164.776 |
| 3 | 06890012 | 0.495747 | 0.00344601 | 165.652 | 06890011 | 0.00000 | 0.499193 | 162.557 |