| Red | Green | Blue | |
| z | 17.64 | ||
| znorm | Inf | ||
| sky | -Inf | -Inf | -Inf |
| S/N | 22.9 | 40.2 | 43.5 |
| S/N(c) | 0.0 | 0.0 | 0.0 |
| SN(E/C) |
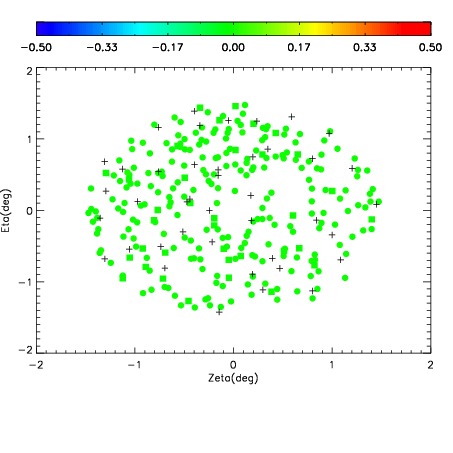
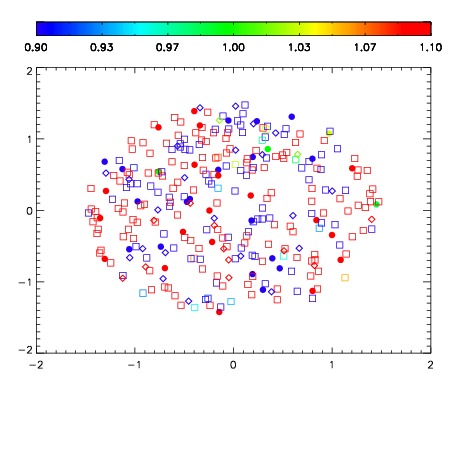
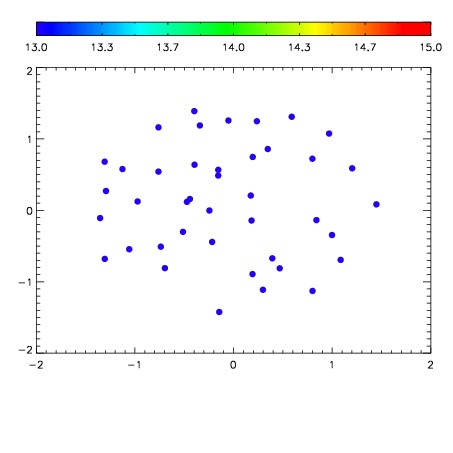

| Frame | Nreads | Zeropoints | Mag plots | Spatial mag deviation | Spatial sky 16325A emission deviations (filled: sky, open: star) | Spatial sky continuum emission | Spatial sky telluric CO2 absorption deviations (filled: H < 10) | |||||||||||||||||||||||
| 0 | 0 |
|
|
|
|
|
|
| IPAIR | NAME | SHIFT | NEWSHIFT | S/N | NAME | SHIFT | NEWSHIFT | S/N |
| 0 | 06080048 | 0.481887 | 0.00000 | 192.258 | 06080047 | 0.00000 | 0.481887 | 189.970 |
| 1 | 06080052 | 0.480131 | 0.00175601 | 200.619 | 06080051 | -0.00547645 | 0.487363 | 202.979 |
| 2 | 06080049 | 0.481864 | 2.30074e-05 | 198.603 | 06080050 | -0.00112302 | 0.483010 | 190.912 |
| 3 | 06080053 | 0.480897 | 0.000990003 | 188.274 | 06080054 | -0.00309498 | 0.484982 | 175.900 |