| Red | Green | Blue | |
| z | 17.64 | ||
| znorm | Inf | ||
| sky | -Inf | -Inf | -Inf |
| S/N | 31.7 | 55.5 | 60.3 |
| S/N(c) | 0.0 | 0.0 | 0.0 |
| SN(E/C) |
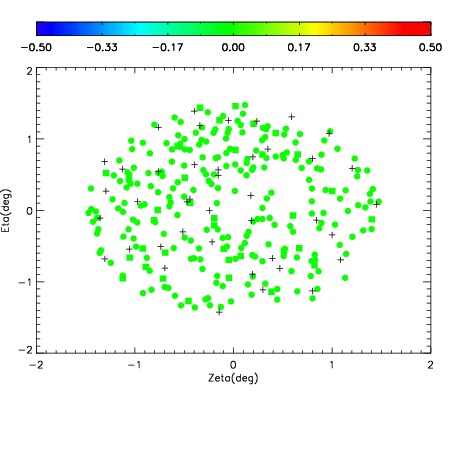
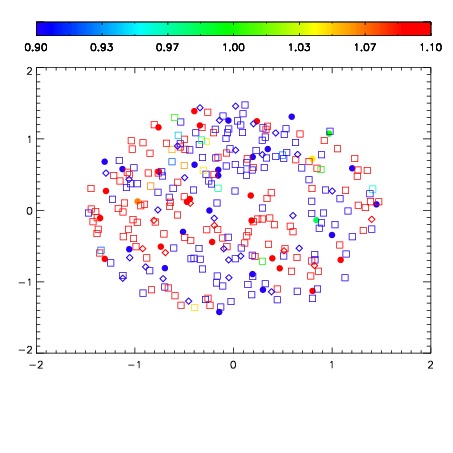
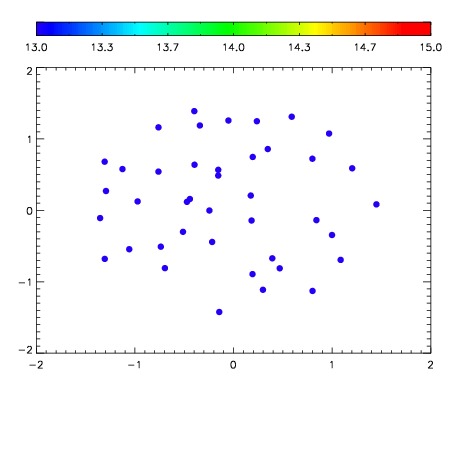

| Frame | Nreads | Zeropoints | Mag plots | Spatial mag deviation | Spatial sky 16325A emission deviations (filled: sky, open: star) | Spatial sky continuum emission | Spatial sky telluric CO2 absorption deviations (filled: H < 10) | |||||||||||||||||||||||
| 0 | 0 |
|
|
|
|
|
|
| IPAIR | NAME | SHIFT | NEWSHIFT | S/N | NAME | SHIFT | NEWSHIFT | S/N |
| 0 | 06310043 | 0.472925 | 0.00000 | 210.944 | 06310048 | -0.000400099 | 0.473325 | 205.241 |
| 1 | 06310038 | 0.472519 | 0.000405997 | 219.682 | 06310037 | 0.00000 | 0.472925 | 218.807 |
| 2 | 06310042 | 0.472387 | 0.000538021 | 214.455 | 06310040 | -0.000759217 | 0.473684 | 212.112 |
| 3 | 06310039 | 0.472777 | 0.000147998 | 214.418 | 06310041 | -0.00350194 | 0.476427 | 210.746 |
| 4 | 06310046 | 0.471490 | 0.00143501 | 201.025 | 06310044 | -0.00393072 | 0.476856 | 204.283 |
| 5 | 06310047 | 0.472163 | 0.000762016 | 200.678 | 06310045 | -0.00161733 | 0.474542 | 191.366 |