| Red | Green | Blue | |
| z | 17.64 | ||
| znorm | Inf | ||
| sky | -Inf | -Inf | -Inf |
| S/N | 27.8 | 47.1 | 53.3 |
| S/N(c) | 0.0 | 0.0 | 0.0 |
| SN(E/C) |

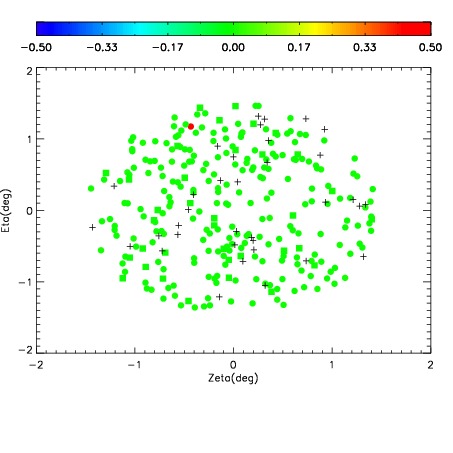
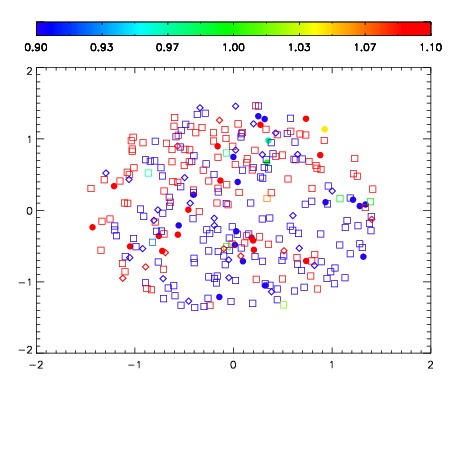
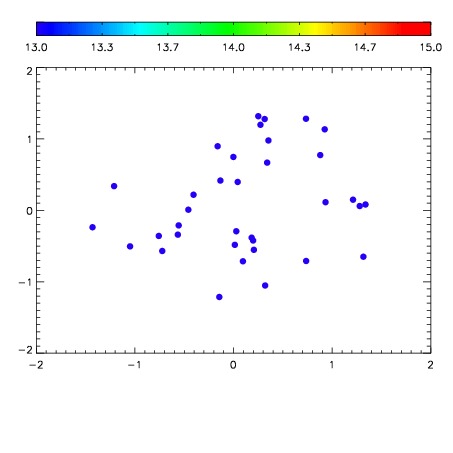

| Frame | Nreads | Zeropoints | Mag plots | Spatial mag deviation | Spatial sky 16325A emission deviations (filled: sky, open: star) | Spatial sky continuum emission | Spatial sky telluric CO2 absorption deviations (filled: H < 10) | |||||||||||||||||||||||
| 0 | 0 |
|
|
|
|
|
|
| IPAIR | NAME | SHIFT | NEWSHIFT | S/N | NAME | SHIFT | NEWSHIFT | S/N |
| 0 | 03070029 | 0.500618 | 0.00000 | 220.500 | 03070030 | 0.00286513 | 0.497753 | 215.413 |
| 1 | 03070024 | 0.499957 | 0.000660986 | 230.735 | 03070027 | 0.000962796 | 0.499655 | 232.145 |
| 2 | 03070025 | 0.500614 | 3.99351e-06 | 227.521 | 03070026 | 0.00129617 | 0.499322 | 226.757 |
| 3 | 03070028 | 0.500257 | 0.000360966 | 222.591 | 03070023 | 0.00000 | 0.500618 | 225.558 |