| Red | Green | Blue | |
| z | 17.64 | ||
| znorm | Inf | ||
| sky | -Inf | -Inf | -Inf |
| S/N | 23.6 | 41.6 | 46.5 |
| S/N(c) | 0.0 | 0.0 | 0.0 |
| SN(E/C) |
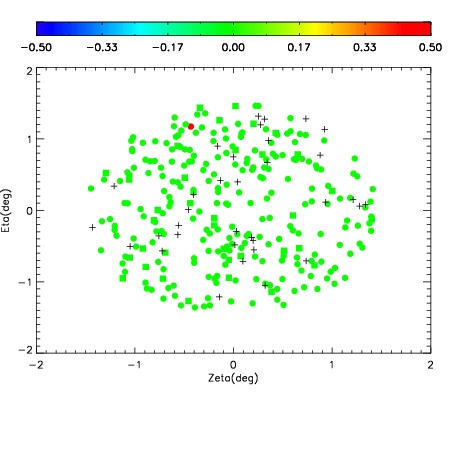
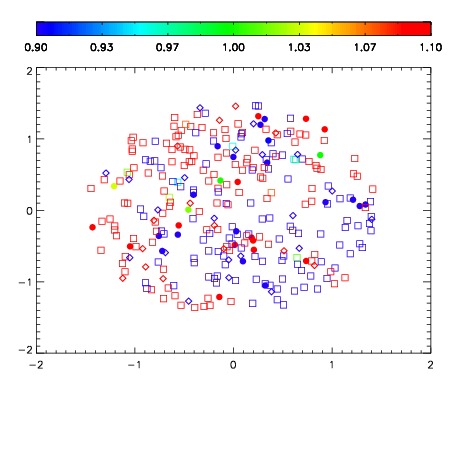
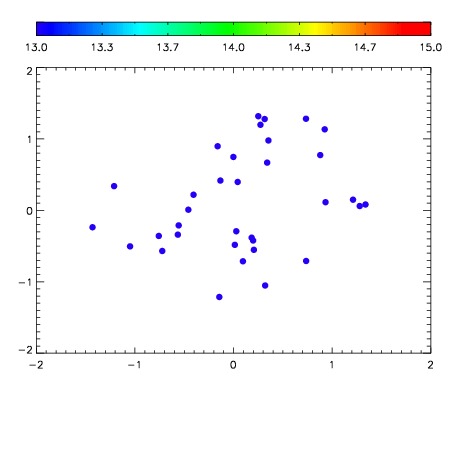

| Frame | Nreads | Zeropoints | Mag plots | Spatial mag deviation | Spatial sky 16325A emission deviations (filled: sky, open: star) | Spatial sky continuum emission | Spatial sky telluric CO2 absorption deviations (filled: H < 10) | |||||||||||||||||||||||
| 0 | 0 |
|
|
|
|
|
|
| IPAIR | NAME | SHIFT | NEWSHIFT | S/N | NAME | SHIFT | NEWSHIFT | S/N |
| 0 | 06090048 | 0.483569 | 0.00000 | 204.171 | 06090054 | -0.000432923 | 0.484002 | 205.423 |
| 1 | 06090049 | 0.483032 | 0.000537008 | 220.036 | 06090050 | 0.000226879 | 0.483342 | 217.314 |
| 2 | 06090053 | 0.482188 | 0.00138101 | 215.951 | 06090051 | -0.000544667 | 0.484114 | 211.897 |
| 3 | 06090052 | 0.482265 | 0.00130400 | 213.274 | 06090047 | 0.00000 | 0.483569 | 205.956 |