| Red | Green | Blue | |
| z | 17.64 | ||
| znorm | Inf | ||
| sky | -Inf | -Inf | -Inf |
| S/N | 20.5 | 36.3 | 41.8 |
| S/N(c) | 0.0 | 0.0 | 0.0 |
| SN(E/C) |
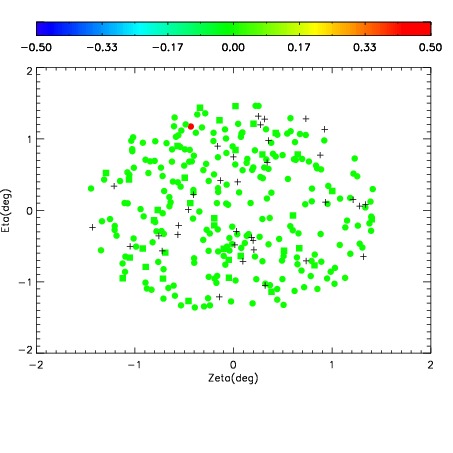
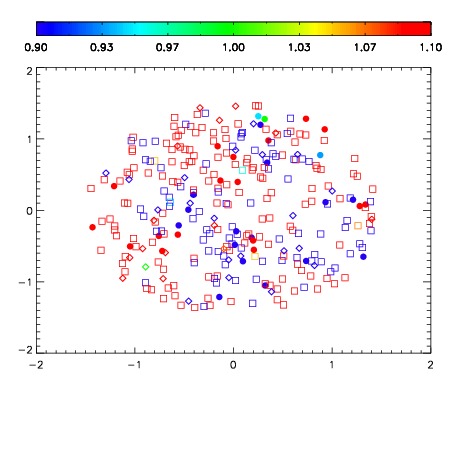
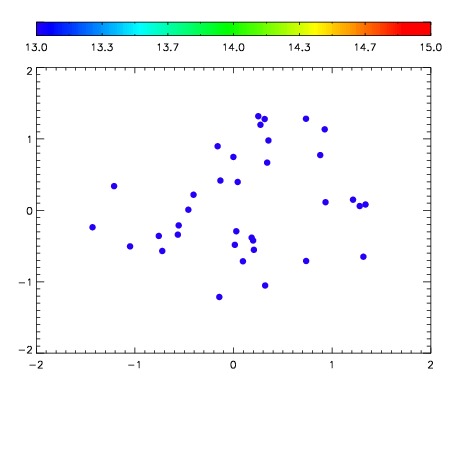

| Frame | Nreads | Zeropoints | Mag plots | Spatial mag deviation | Spatial sky 16325A emission deviations (filled: sky, open: star) | Spatial sky continuum emission | Spatial sky telluric CO2 absorption deviations (filled: H < 10) | |||||||||||||||||||||||
| 0 | 0 |
|
|
|
|
|
|
| IPAIR | NAME | SHIFT | NEWSHIFT | S/N | NAME | SHIFT | NEWSHIFT | S/N |
| 0 | 06420035 | 0.489064 | 0.00000 | 190.485 | 06420033 | 0.00000 | 0.489064 | 185.543 |
| 1 | 06420039 | 0.485778 | 0.00328600 | 209.802 | 06420037 | 0.00220023 | 0.486864 | 192.214 |
| 2 | 06420038 | 0.485577 | 0.00348702 | 207.867 | 06420040 | 0.00403184 | 0.485032 | 187.047 |
| 3 | 06420034 | 0.488287 | 0.000777006 | 189.790 | 06420036 | 0.00239296 | 0.486671 | 183.081 |