| Red | Green | Blue | |
| z | 17.64 | ||
| znorm | Inf | ||
| sky | -Inf | -Inf | -Inf |
| S/N | 23.6 | 41.8 | 45.3 |
| S/N(c) | 0.0 | 0.0 | 0.0 |
| SN(E/C) |
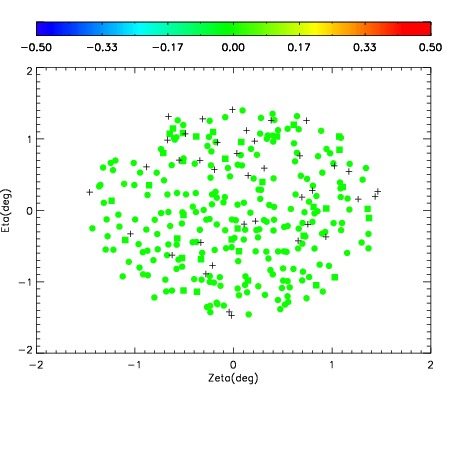
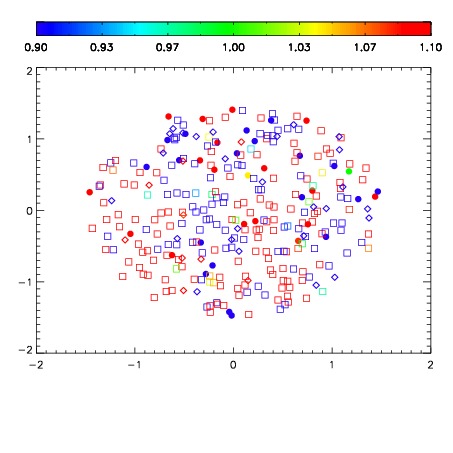
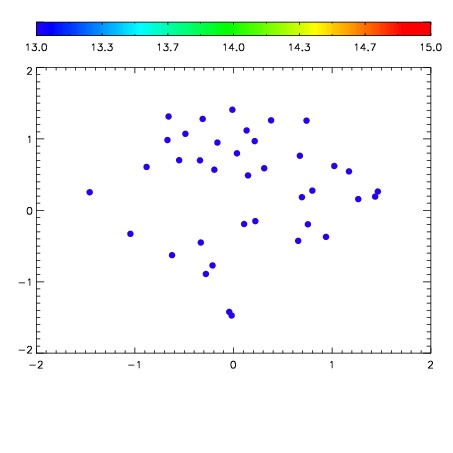

| Frame | Nreads | Zeropoints | Mag plots | Spatial mag deviation | Spatial sky 16325A emission deviations (filled: sky, open: star) | Spatial sky continuum emission | Spatial sky telluric CO2 absorption deviations (filled: H < 10) | |||||||||||||||||||||||
| 0 | 0 |
|
|
|
|
|
|
| IPAIR | NAME | SHIFT | NEWSHIFT | S/N | NAME | SHIFT | NEWSHIFT | S/N |
| 0 | 05480049 | 0.487778 | 0.00000 | 216.913 | 05480051 | -0.000734309 | 0.488512 | 204.946 |
| 1 | 05480052 | 0.486942 | 0.000836015 | 228.505 | 05480047 | 0.00000 | 0.487778 | 216.744 |
| 2 | 05480053 | 0.485846 | 0.00193200 | 222.683 | 05480054 | -0.00146585 | 0.489244 | 214.602 |
| 3 | 05480048 | 0.487468 | 0.000310004 | 211.968 | 05480050 | -0.00236318 | 0.490141 | 168.310 |