| Red | Green | Blue | |
| z | 17.64 | ||
| znorm | Inf | ||
| sky | -Inf | -Inf | -Inf |
| S/N | 29.7 | 49.6 | 54.5 |
| S/N(c) | 0.0 | 0.0 | 0.0 |
| SN(E/C) |
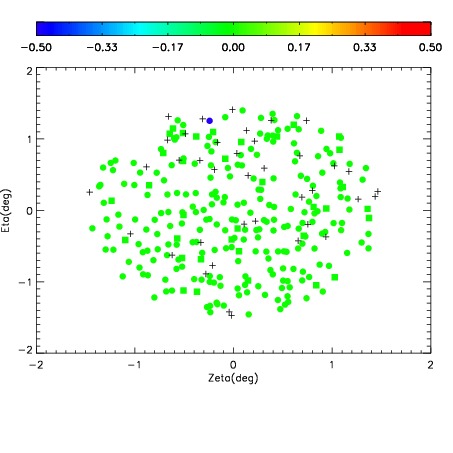
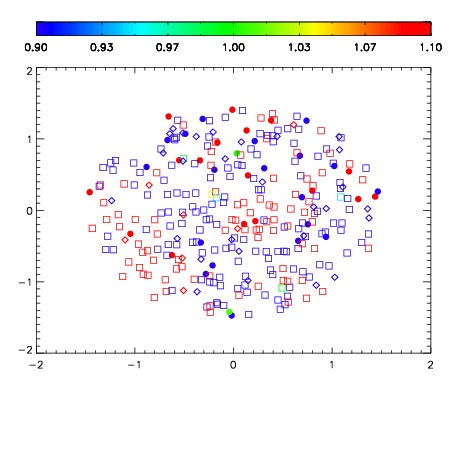
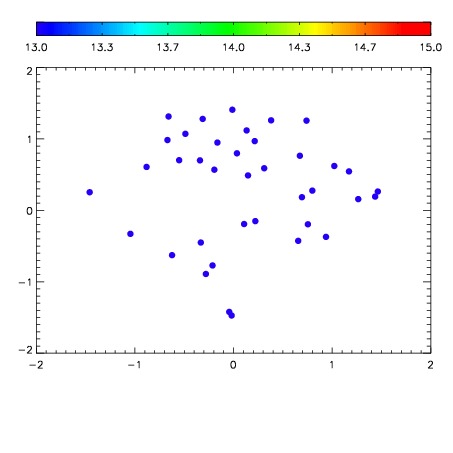

| Frame | Nreads | Zeropoints | Mag plots | Spatial mag deviation | Spatial sky 16325A emission deviations (filled: sky, open: star) | Spatial sky continuum emission | Spatial sky telluric CO2 absorption deviations (filled: H < 10) | |||||||||||||||||||||||
| 0 | 0 |
|
|
|
|
|
|
| IPAIR | NAME | SHIFT | NEWSHIFT | S/N | NAME | SHIFT | NEWSHIFT | S/N |
| 0 | 06300027 | 0.485996 | 0.00000 | 225.202 | 06300028 | 0.00173838 | 0.484258 | 224.433 |
| 1 | 06300026 | 0.485334 | 0.000661999 | 234.292 | 06300025 | 0.00000 | 0.485996 | 241.172 |
| 2 | 06300030 | 0.481655 | 0.00434101 | 233.730 | 06300033 | -0.00132940 | 0.487325 | 225.151 |
| 3 | 06300031 | 0.481988 | 0.00400800 | 217.498 | 06300032 | 0.000843467 | 0.485153 | 218.808 |
| 4 | 06300034 | 0.481421 | 0.00457501 | 100.397 | 06300029 | -0.000442695 | 0.486439 | 208.459 |
| 5 | 06300035 | 0.482094 | 0.00390202 | 83.0640 | 06300036 | -0.00494717 | 0.490943 | 162.909 |