| Red | Green | Blue | |
| z | 17.64 | ||
| znorm | Inf | ||
| sky | -Inf | -Inf | -Inf |
| S/N | 30.1 | 49.6 | 56.1 |
| S/N(c) | 0.0 | 0.0 | 0.0 |
| SN(E/C) |
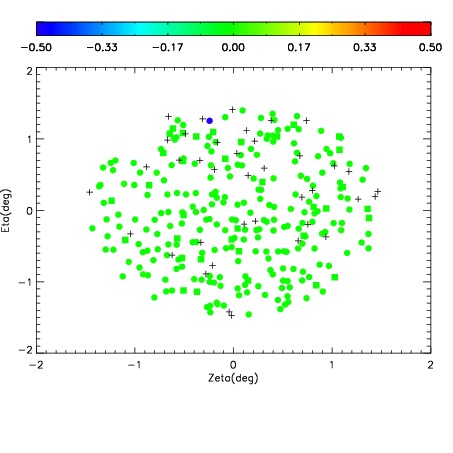
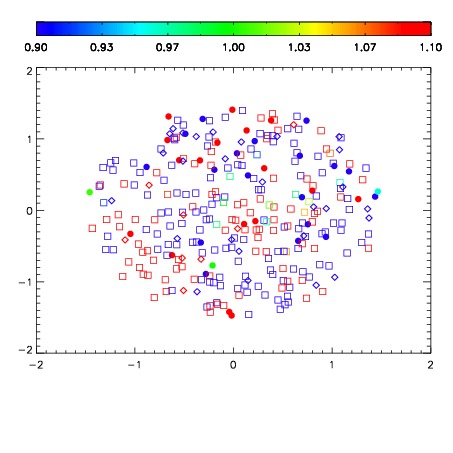


| Frame | Nreads | Zeropoints | Mag plots | Spatial mag deviation | Spatial sky 16325A emission deviations (filled: sky, open: star) | Spatial sky continuum emission | Spatial sky telluric CO2 absorption deviations (filled: H < 10) | |||||||||||||||||||||||
| 0 | 0 |
|
|
|
|
|
|
| IPAIR | NAME | SHIFT | NEWSHIFT | S/N | NAME | SHIFT | NEWSHIFT | S/N |
| 0 | 06330026 | 0.469684 | 0.00000 | 239.281 | 06330031 | -0.00110275 | 0.470787 | 243.738 |
| 1 | 06330025 | 0.469352 | 0.000331998 | 245.961 | 06330024 | 0.00000 | 0.469684 | 246.848 |
| 2 | 06330029 | 0.468052 | 0.00163200 | 245.780 | 06330028 | -0.00172997 | 0.471414 | 245.850 |
| 3 | 06330030 | 0.468637 | 0.00104702 | 240.617 | 06330027 | -0.00109356 | 0.470778 | 244.891 |