| Red | Green | Blue | |
| z | 17.64 | ||
| znorm | Inf | ||
| sky | -Inf | -Inf | -Inf |
| S/N | 20.9 | 37.3 | 41.1 |
| S/N(c) | 0.0 | 0.0 | 0.0 |
| SN(E/C) |
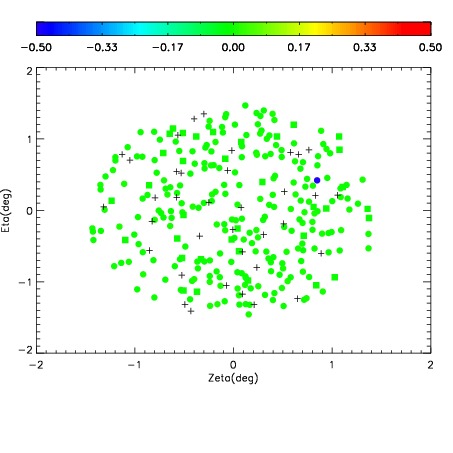
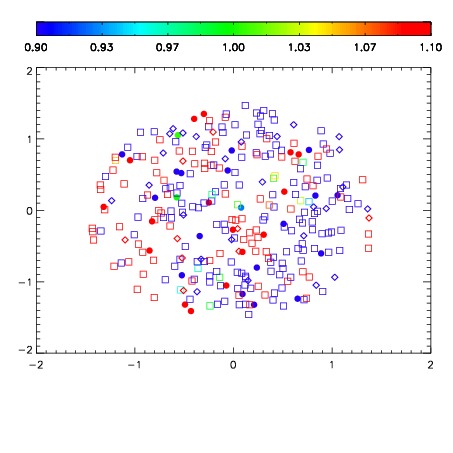


| Frame | Nreads | Zeropoints | Mag plots | Spatial mag deviation | Spatial sky 16325A emission deviations (filled: sky, open: star) | Spatial sky continuum emission | Spatial sky telluric CO2 absorption deviations (filled: H < 10) | |||||||||||||||||||||||
| 0 | 0 |
|
|
|
|
|
|
| IPAIR | NAME | SHIFT | NEWSHIFT | S/N | NAME | SHIFT | NEWSHIFT | S/N |
| 0 | 05490061 | 0.485088 | 0.00000 | 74.1086 | 05490066 | 0.00343518 | 0.481653 | 106.871 |
| 1 | 05490060 | 0.482963 | 0.00212499 | 207.054 | 05490059 | 0.00000 | 0.485088 | 209.349 |
| 2 | 05490068 | 0.482489 | 0.00259900 | 203.693 | 05490070 | -0.00245662 | 0.487545 | 204.222 |
| 3 | 05490069 | 0.484385 | 0.000702977 | 157.280 | 05490067 | 0.000231089 | 0.484857 | 201.795 |