| Red | Green | Blue | |
| z | 17.64 | ||
| znorm | Inf | ||
| sky | -Inf | -Inf | -Inf |
| S/N | 28.2 | 48.4 | 53.2 |
| S/N(c) | 0.0 | 0.0 | 0.0 |
| SN(E/C) |
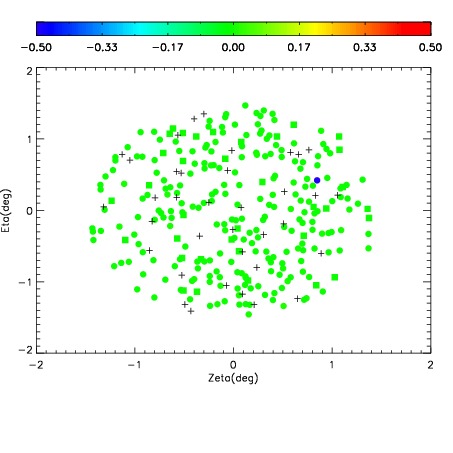
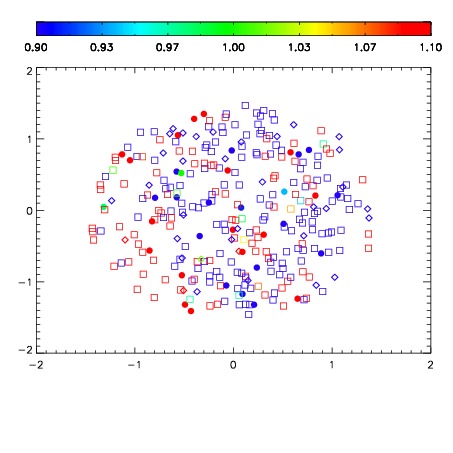
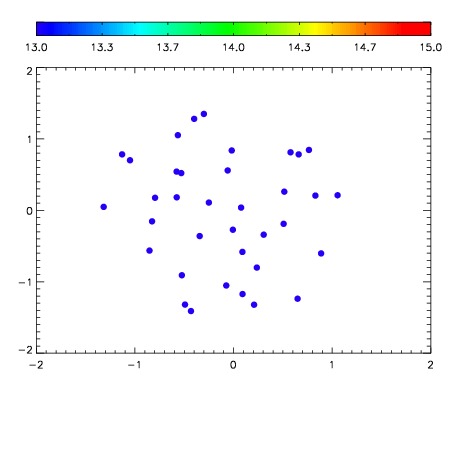

| Frame | Nreads | Zeropoints | Mag plots | Spatial mag deviation | Spatial sky 16325A emission deviations (filled: sky, open: star) | Spatial sky continuum emission | Spatial sky telluric CO2 absorption deviations (filled: H < 10) | |||||||||||||||||||||||
| 0 | 0 |
|
|
|
|
|
|
| IPAIR | NAME | SHIFT | NEWSHIFT | S/N | NAME | SHIFT | NEWSHIFT | S/N |
| 0 | 06100041 | 0.490284 | 0.00000 | 226.210 | 06100043 | -0.000275271 | 0.490559 | 225.272 |
| 1 | 06100042 | 0.489785 | 0.000499010 | 230.485 | 06100039 | 0.00253134 | 0.487753 | 227.367 |
| 2 | 06100038 | 0.487502 | 0.00278199 | 221.434 | 06100040 | 0.00138494 | 0.488899 | 223.770 |
| 3 | 06100037 | 0.486641 | 0.00364301 | 215.450 | 06100036 | 0.00000 | 0.490284 | 211.872 |