| Red | Green | Blue | |
| z | 17.64 | ||
| znorm | Inf | ||
| sky | -Inf | -Inf | -Inf |
| S/N | 23.5 | 41.6 | 45.6 |
| S/N(c) | 0.0 | 0.0 | 0.0 |
| SN(E/C) |
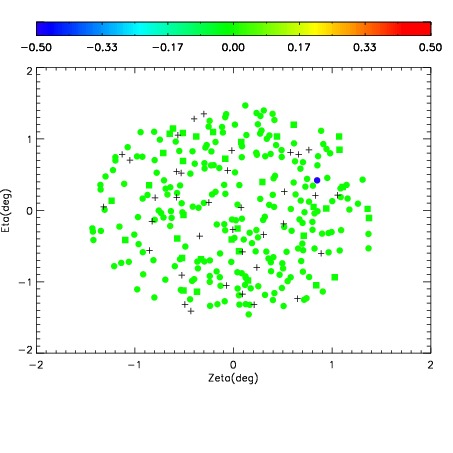

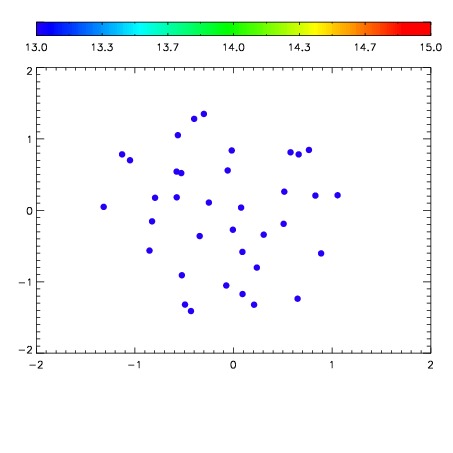

| Frame | Nreads | Zeropoints | Mag plots | Spatial mag deviation | Spatial sky 16325A emission deviations (filled: sky, open: star) | Spatial sky continuum emission | Spatial sky telluric CO2 absorption deviations (filled: H < 10) | |||||||||||||||||||||||
| 0 | 0 |
|
|
|
|
|
|
| IPAIR | NAME | SHIFT | NEWSHIFT | S/N | NAME | SHIFT | NEWSHIFT | S/N |
| 0 | 06420028 | 0.488469 | 0.00000 | 205.102 | 06420025 | 0.00237108 | 0.486098 | 189.089 |
| 1 | 06420027 | 0.488111 | 0.000358015 | 207.311 | 06420022 | 0.00000 | 0.488469 | 223.114 |
| 2 | 06420024 | 0.483829 | 0.00464001 | 207.151 | 06420026 | 0.00272739 | 0.485742 | 195.115 |
| 3 | 06420023 | 0.483436 | 0.00503302 | 204.976 | 06420029 | 0.00310861 | 0.485360 | 176.998 |