| Red | Green | Blue | |
| z | 17.63 | ||
| znorm | Inf | ||
| sky | -NaN | -NaN | -Inf |
| S/N | 23.0 | 38.0 | 40.3 |
| S/N(c) | 0.0 | 0.0 | 0.0 |
| SN(E/C) |
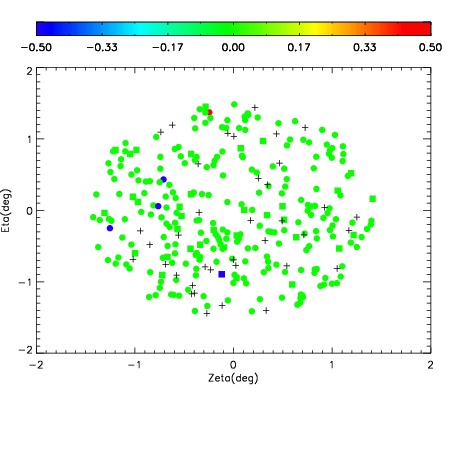
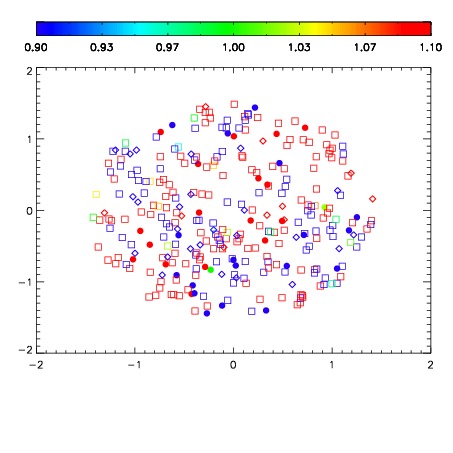
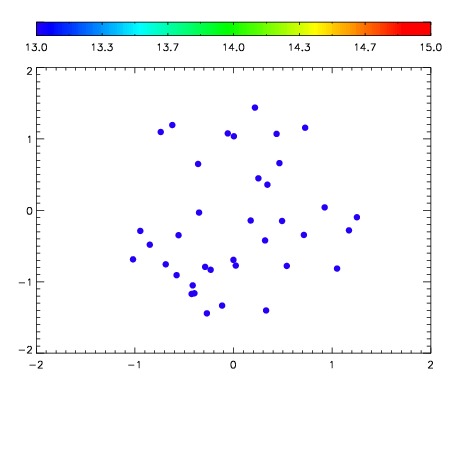

| Frame | Nreads | Zeropoints | Mag plots | Spatial mag deviation | Spatial sky 16325A emission deviations (filled: sky, open: star) | Spatial sky continuum emission | Spatial sky telluric CO2 absorption deviations (filled: H < 10) | |||||||||||||||||||||||
| 0 | 0 |
|
|
|
|
|
|
| IPAIR | NAME | SHIFT | NEWSHIFT | S/N | NAME | SHIFT | NEWSHIFT | S/N |
| 0 | 02830041 | 0.413492 | 0.00000 | 239.128 | 02830039 | 3.48379e-05 | 0.413457 | 235.834 |
| 1 | 02830037 | 0.413437 | 5.49853e-05 | 239.584 | 02830038 | 0.00360286 | 0.409889 | 238.420 |
| 2 | 02830040 | 0.412715 | 0.000777006 | 237.876 | 02830042 | 0.00431945 | 0.409173 | 234.275 |
| 3 | 02830036 | 0.411780 | 0.00171199 | 225.067 | 02830035 | 0.00000 | 0.413492 | 225.416 |