| Red | Green | Blue | |
| z | 17.64 | ||
| znorm | Inf | ||
| sky | -NaN | -NaN | -Inf |
| S/N | 25.8 | 45.4 | 48.9 |
| S/N(c) | 0.0 | 0.0 | 0.0 |
| SN(E/C) |

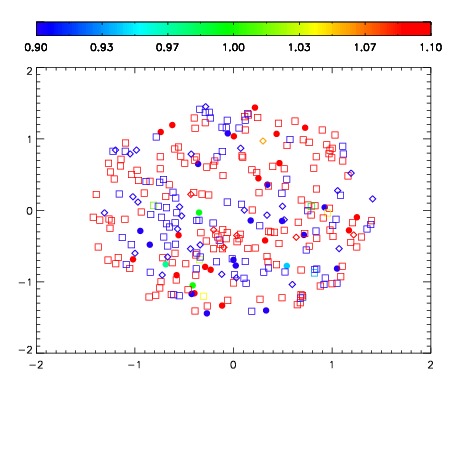
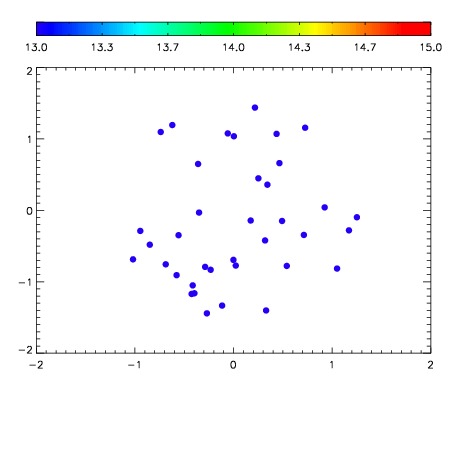

| Frame | Nreads | Zeropoints | Mag plots | Spatial mag deviation | Spatial sky 16325A emission deviations (filled: sky, open: star) | Spatial sky continuum emission | Spatial sky telluric CO2 absorption deviations (filled: H < 10) | |||||||||||||||||||||||
| 0 | 0 |
|
|
|
|
|
|
| IPAIR | NAME | SHIFT | NEWSHIFT | S/N | NAME | SHIFT | NEWSHIFT | S/N |
| 0 | 02860048 | 0.412737 | 0.00000 | 266.094 | 02860049 | 0.00153617 | 0.411201 | 266.791 |
| 1 | 02860047 | 0.412028 | 0.000708997 | 264.414 | 02860045 | 0.00391342 | 0.408824 | 261.727 |
| 2 | 02860044 | 0.411913 | 0.000824004 | 262.944 | 02860046 | 0.00127803 | 0.411459 | 260.855 |
| 3 | 02860043 | 0.411331 | 0.00140601 | 262.769 | 02860042 | 0.00000 | 0.412737 | 260.801 |