| Red | Green | Blue | |
| z | 17.64 | ||
| znorm | Inf | ||
| sky | -NaN | -Inf | -Inf |
| S/N | 25.6 | 43.9 | 49.9 |
| S/N(c) | 0.0 | 0.0 | 0.0 |
| SN(E/C) |
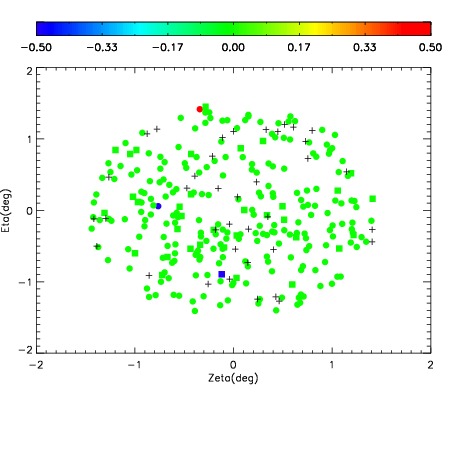
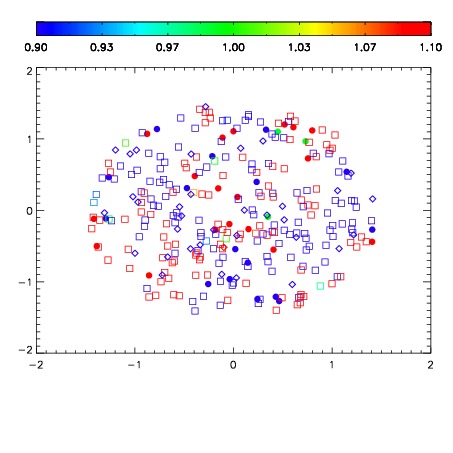
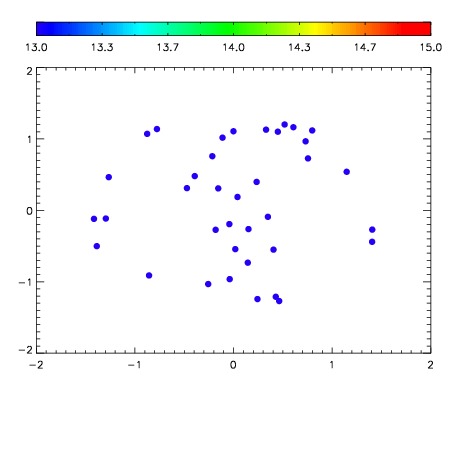

| Frame | Nreads | Zeropoints | Mag plots | Spatial mag deviation | Spatial sky 16325A emission deviations (filled: sky, open: star) | Spatial sky continuum emission | Spatial sky telluric CO2 absorption deviations (filled: H < 10) | |||||||||||||||||||||||
| 0 | 0 |
|
|
|
|
|
|
| IPAIR | NAME | SHIFT | NEWSHIFT | S/N | NAME | SHIFT | NEWSHIFT | S/N |
| 0 | 02610045 | 0.425727 | 0.00000 | 259.239 | 02610046 | 7.87326e-05 | 0.425648 | 236.688 |
| 1 | 02610041 | 0.425476 | 0.000250995 | 266.010 | 02610039 | 0.00000 | 0.425727 | 260.996 |
| 2 | 02610040 | 0.425427 | 0.000300020 | 262.900 | 02610043 | -0.00219292 | 0.427920 | 249.004 |
| 3 | 02610044 | 0.424704 | 0.00102302 | 262.763 | 02610042 | 0.000707415 | 0.425020 | 238.588 |