| Red | Green | Blue | |
| z | 17.64 | ||
| znorm | Inf | ||
| sky | -NaN | -Inf | -Inf |
| S/N | 27.1 | 47.0 | 52.9 |
| S/N(c) | 0.0 | 0.0 | 0.0 |
| SN(E/C) |
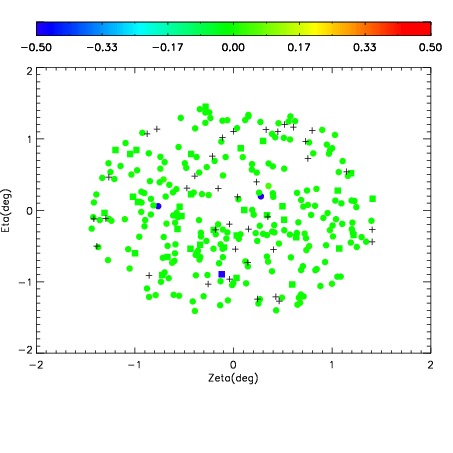

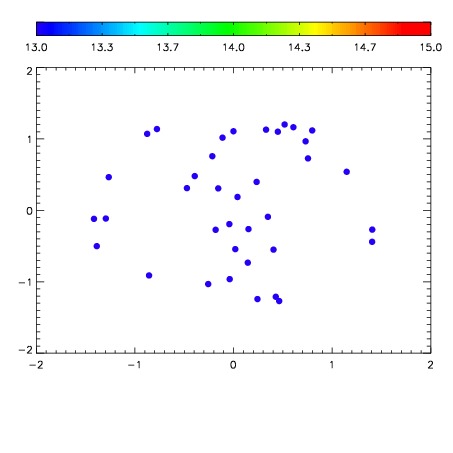

| Frame | Nreads | Zeropoints | Mag plots | Spatial mag deviation | Spatial sky 16325A emission deviations (filled: sky, open: star) | Spatial sky continuum emission | Spatial sky telluric CO2 absorption deviations (filled: H < 10) | |||||||||||||||||||||||
| 0 | 0 |
|
|
|
|
|
|
| IPAIR | NAME | SHIFT | NEWSHIFT | S/N | NAME | SHIFT | NEWSHIFT | S/N |
| 0 | 02890040 | 0.402320 | 0.00000 | 236.310 | 02890042 | -0.00488002 | 0.407200 | 242.161 |
| 1 | 02890044 | 0.399948 | 0.00237200 | 240.118 | 02890041 | -2.51811e-05 | 0.402345 | 242.395 |
| 2 | 02890043 | 0.398955 | 0.00336501 | 236.280 | 02890038 | 0.00000 | 0.402320 | 237.656 |
| 3 | 02890039 | 0.400603 | 0.00171700 | 234.121 | 02890045 | -0.00116287 | 0.403483 | 236.133 |