| Red | Green | Blue | |
| z | 17.63 | ||
| znorm | Inf | ||
| sky | -NaN | -NaN | -Inf |
| S/N | 28.3 | 50.0 | 55.2 |
| S/N(c) | 0.0 | 0.0 | 0.0 |
| SN(E/C) |
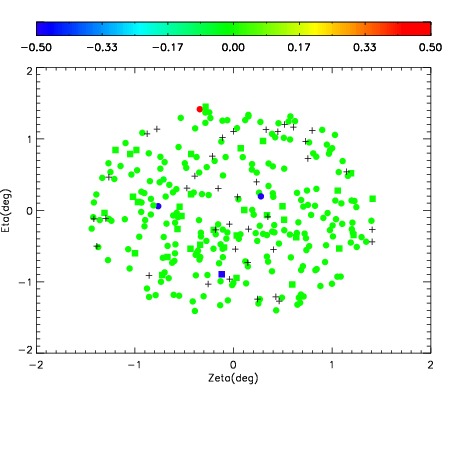
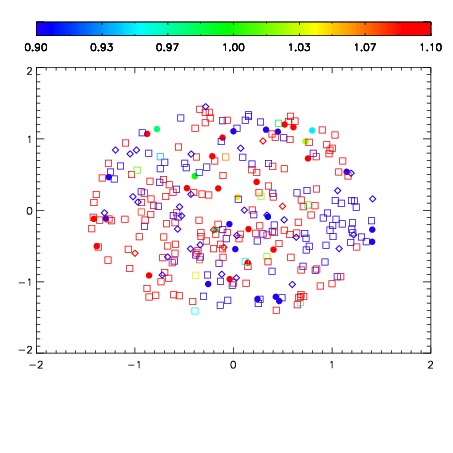


| Frame | Nreads | Zeropoints | Mag plots | Spatial mag deviation | Spatial sky 16325A emission deviations (filled: sky, open: star) | Spatial sky continuum emission | Spatial sky telluric CO2 absorption deviations (filled: H < 10) | |||||||||||||||||||||||
| 0 | 0 |
|
|
|
|
|
|
| IPAIR | NAME | SHIFT | NEWSHIFT | S/N | NAME | SHIFT | NEWSHIFT | S/N |
| 0 | 03040025 | 0.496376 | 0.00000 | 244.684 | 03040026 | -0.00154778 | 0.497924 | 243.695 |
| 1 | 03040029 | 0.496255 | 0.000120997 | 254.322 | 03040030 | -0.000213264 | 0.496589 | 253.090 |
| 2 | 03040028 | 0.495980 | 0.000396013 | 248.047 | 03040027 | -0.00213780 | 0.498514 | 247.236 |
| 3 | 03040024 | 0.495330 | 0.00104600 | 238.396 | 03040023 | 0.00000 | 0.496376 | 224.231 |