| Red | Green | Blue | |
| z | 17.64 | ||
| znorm | Inf | ||
| sky | -NaN | -Inf | -Inf |
| S/N | 27.8 | 47.7 | 51.8 |
| S/N(c) | 0.0 | 0.0 | 0.0 |
| SN(E/C) |
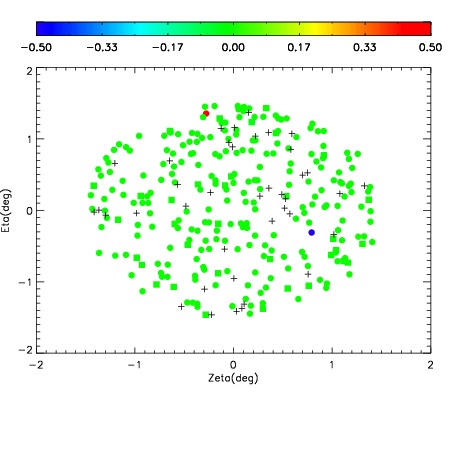
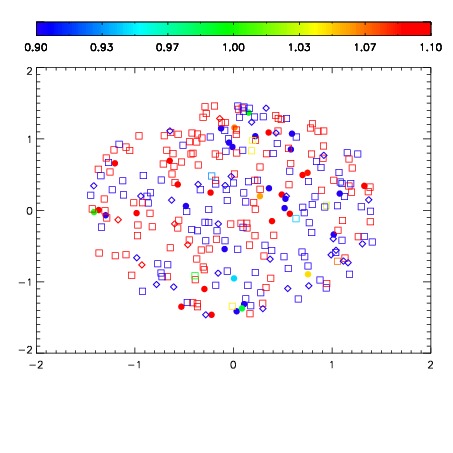
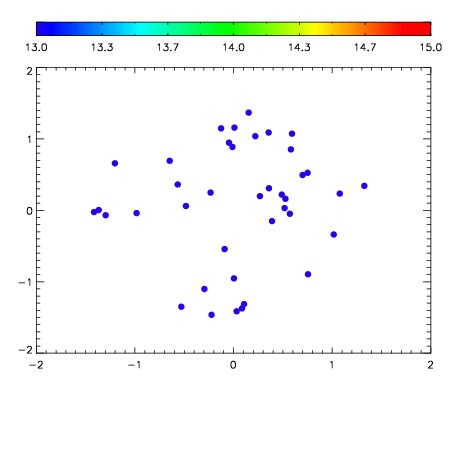

| Frame | Nreads | Zeropoints | Mag plots | Spatial mag deviation | Spatial sky 16325A emission deviations (filled: sky, open: star) | Spatial sky continuum emission | Spatial sky telluric CO2 absorption deviations (filled: H < 10) | |||||||||||||||||||||||
| 0 | 0 |
|
|
|
|
|
|
| IPAIR | NAME | SHIFT | NEWSHIFT | S/N | NAME | SHIFT | NEWSHIFT | S/N |
| 0 | 02880033 | 0.413291 | 0.00000 | 197.501 | 02880034 | 0.00226015 | 0.411031 | 197.637 |
| 1 | 02880028 | 0.410854 | 0.00243700 | 202.474 | 02880027 | 0.00000 | 0.413291 | 199.339 |
| 2 | 02880029 | 0.411925 | 0.00136602 | 201.314 | 02880031 | -2.48435e-05 | 0.413316 | 198.052 |
| 3 | 02880032 | 0.413001 | 0.000290006 | 195.046 | 02880030 | 0.00123210 | 0.412059 | 188.475 |