| Red | Green | Blue | |
| z | 17.64 | ||
| znorm | Inf | ||
| sky | -Inf | -Inf | -Inf |
| S/N | 27.7 | 48.1 | 49.8 |
| S/N(c) | 0.0 | 0.0 | 0.0 |
| SN(E/C) |
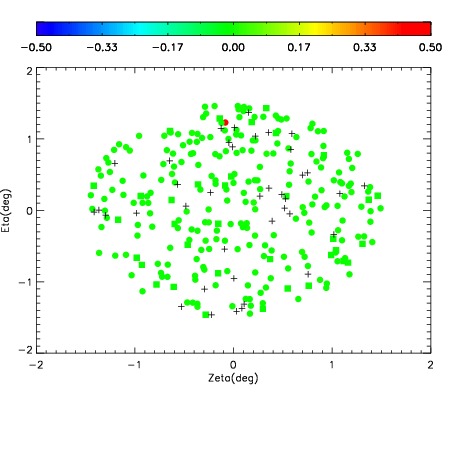
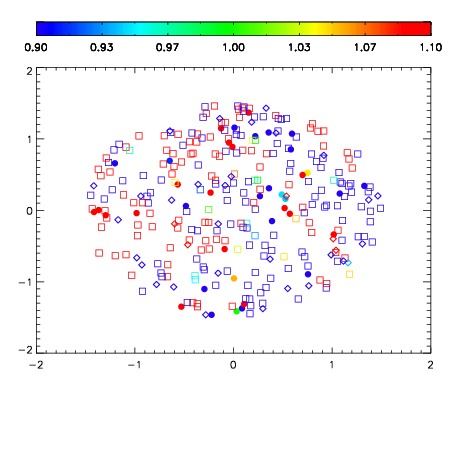
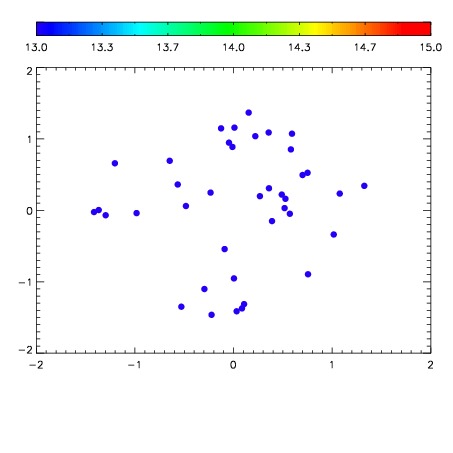

| Frame | Nreads | Zeropoints | Mag plots | Spatial mag deviation | Spatial sky 16325A emission deviations (filled: sky, open: star) | Spatial sky continuum emission | Spatial sky telluric CO2 absorption deviations (filled: H < 10) | |||||||||||||||||||||||
| 0 | 0 |
|
|
|
|
|
|
| IPAIR | NAME | SHIFT | NEWSHIFT | S/N | NAME | SHIFT | NEWSHIFT | S/N |
| 0 | 03060031 | 0.496279 | 0.00000 | 199.253 | 03060032 | 0.00331553 | 0.492963 | 208.751 |
| 1 | 03060030 | 0.495842 | 0.000436991 | 195.820 | 03060025 | 0.00000 | 0.496279 | 193.541 |
| 2 | 03060026 | 0.493937 | 0.00234202 | 192.365 | 03060029 | -0.00176565 | 0.498045 | 191.710 |
| 3 | 03060027 | 0.494862 | 0.00141701 | 174.364 | 03060028 | -0.00138310 | 0.497662 | 181.752 |