| Red | Green | Blue | |
| z | 17.64 | ||
| znorm | Inf | ||
| sky | -Inf | -Inf | -Inf |
| S/N | 25.4 | 44.0 | 46.3 |
| S/N(c) | 0.0 | 0.0 | 0.0 |
| SN(E/C) |
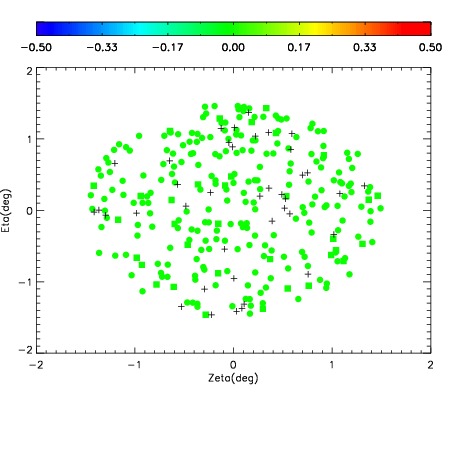
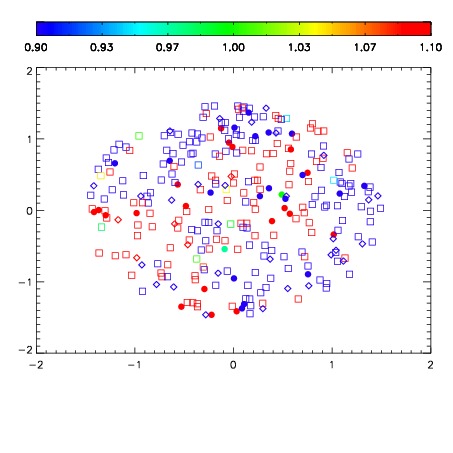
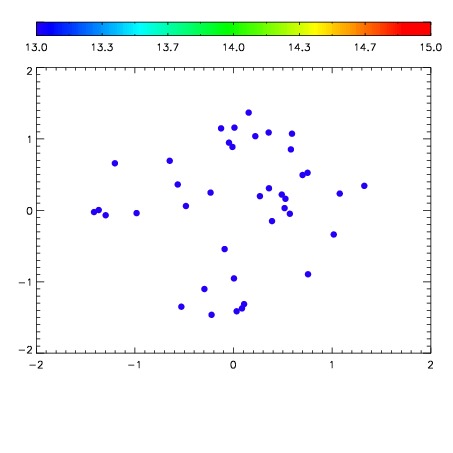

| Frame | Nreads | Zeropoints | Mag plots | Spatial mag deviation | Spatial sky 16325A emission deviations (filled: sky, open: star) | Spatial sky continuum emission | Spatial sky telluric CO2 absorption deviations (filled: H < 10) | |||||||||||||||||||||||
| 0 | 0 |
|
|
|
|
|
|
| IPAIR | NAME | SHIFT | NEWSHIFT | S/N | NAME | SHIFT | NEWSHIFT | S/N |
| 0 | 03140025 | 0.500575 | 0.00000 | 173.477 | 03140023 | 0.00000 | 0.500575 | 168.897 |
| 1 | 03140029 | 0.499754 | 0.000820994 | 176.567 | 03140030 | -0.00109798 | 0.501673 | 180.313 |
| 2 | 03140024 | 0.499081 | 0.00149402 | 162.678 | 03140027 | 0.00112848 | 0.499447 | 162.341 |
| 3 | 03140028 | 0.498336 | 0.00223902 | 160.429 | 03140026 | 0.00306458 | 0.497510 | 148.615 |