| Red | Green | Blue | |
| z | 17.64 | ||
| znorm | Inf | ||
| sky | -Inf | -Inf | -Inf |
| S/N | 25.6 | 45.7 | 52.4 |
| S/N(c) | 0.0 | 0.0 | 0.0 |
| SN(E/C) |
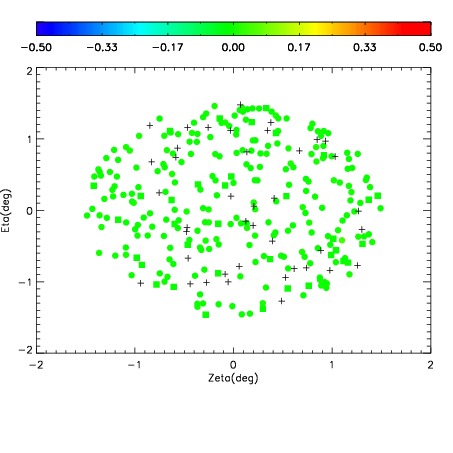
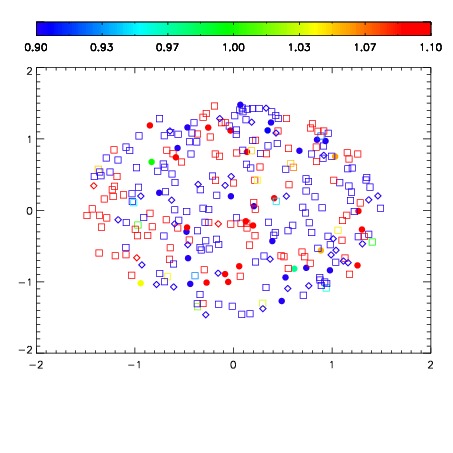
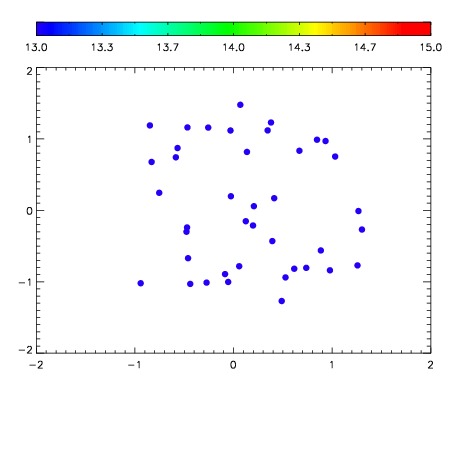

| Frame | Nreads | Zeropoints | Mag plots | Spatial mag deviation | Spatial sky 16325A emission deviations (filled: sky, open: star) | Spatial sky continuum emission | Spatial sky telluric CO2 absorption deviations (filled: H < 10) | |||||||||||||||||||||||
| 0 | 0 |
|
|
|
|
|
|
| IPAIR | NAME | SHIFT | NEWSHIFT | S/N | NAME | SHIFT | NEWSHIFT | S/N |
| 0 | 02870051 | 0.416696 | 0.00000 | 195.794 | 02870052 | 0.00264289 | 0.414053 | 197.495 |
| 1 | 02870054 | 0.414485 | 0.00221100 | 218.535 | 02870056 | 0.00399665 | 0.412699 | 217.786 |
| 2 | 02870055 | 0.416270 | 0.000426024 | 217.658 | 02870053 | 0.000856441 | 0.415840 | 212.533 |
| 3 | 02870050 | 0.415528 | 0.00116801 | 197.422 | 02870049 | 0.00000 | 0.416696 | 198.486 |