| Red | Green | Blue | |
| z | 17.64 | ||
| znorm | Inf | ||
| sky | -Inf | -Inf | -Inf |
| S/N | 26.8 | 47.7 | 54.3 |
| S/N(c) | 0.0 | 0.0 | 0.0 |
| SN(E/C) |
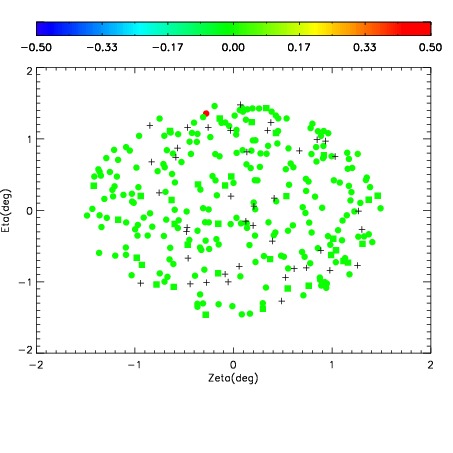
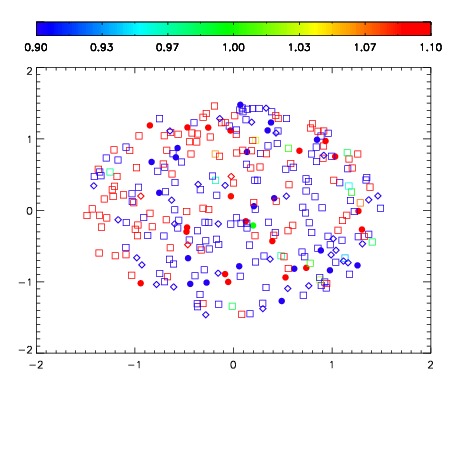
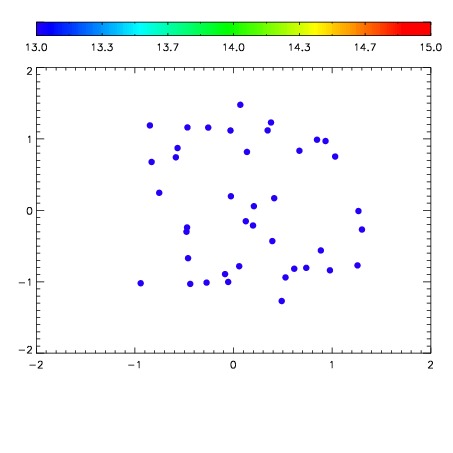

| Frame | Nreads | Zeropoints | Mag plots | Spatial mag deviation | Spatial sky 16325A emission deviations (filled: sky, open: star) | Spatial sky continuum emission | Spatial sky telluric CO2 absorption deviations (filled: H < 10) | |||||||||||||||||||||||
| 0 | 0 |
|
|
|
|
|
|
| IPAIR | NAME | SHIFT | NEWSHIFT | S/N | NAME | SHIFT | NEWSHIFT | S/N |
| 0 | 03050041 | 0.497898 | 0.00000 | 211.329 | 03050039 | -0.000856555 | 0.498755 | 205.869 |
| 1 | 03050040 | 0.497148 | 0.000750005 | 207.039 | 03050038 | 0.00159116 | 0.496307 | 205.104 |
| 2 | 03050036 | 0.496452 | 0.00144601 | 206.860 | 03050042 | 0.00541302 | 0.492485 | 205.004 |
| 3 | 03050037 | 0.496829 | 0.00106901 | 206.425 | 03050035 | 0.00000 | 0.497898 | 203.376 |