| Red | Green | Blue | |
| z | 17.64 | ||
| znorm | Inf | ||
| sky | -Inf | -NaN | -Inf |
| S/N | 25.1 | 43.0 | 46.0 |
| S/N(c) | 0.0 | 0.0 | 0.0 |
| SN(E/C) |
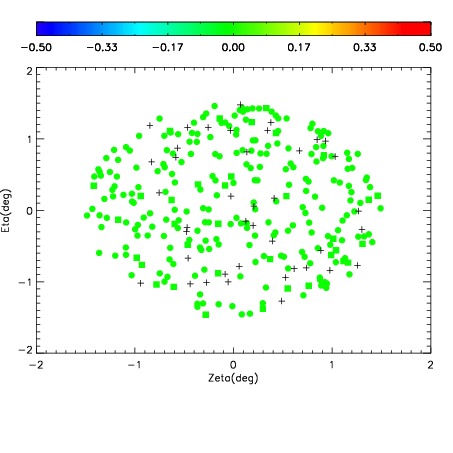
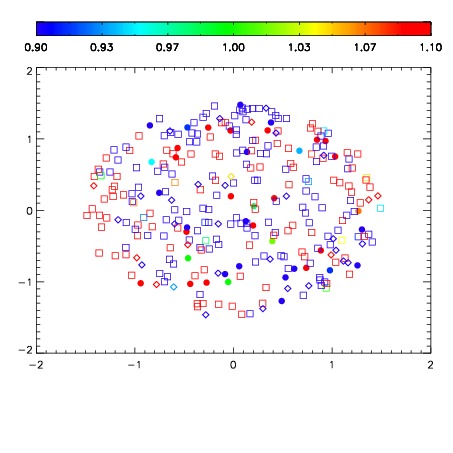
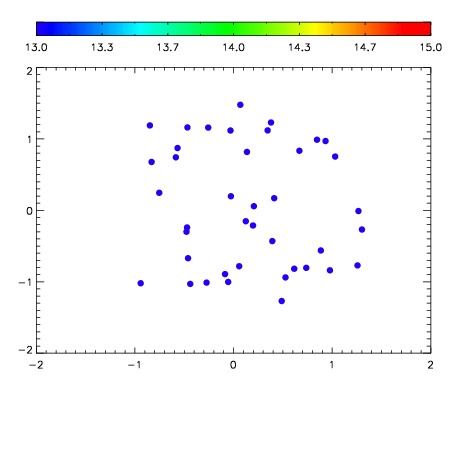

| Frame | Nreads | Zeropoints | Mag plots | Spatial mag deviation | Spatial sky 16325A emission deviations (filled: sky, open: star) | Spatial sky continuum emission | Spatial sky telluric CO2 absorption deviations (filled: H < 10) | |||||||||||||||||||||||
| 0 | 0 |
|
|
|
|
|
|
| IPAIR | NAME | SHIFT | NEWSHIFT | S/N | NAME | SHIFT | NEWSHIFT | S/N |
| 0 | 03190016 | 0.503729 | 0.00000 | 218.199 | 03190017 | 0.00116720 | 0.502562 | 210.936 |
| 1 | 03190012 | 0.501010 | 0.00271899 | 225.411 | 03190013 | -0.00231352 | 0.506042 | 225.041 |
| 2 | 03190015 | 0.502432 | 0.00129700 | 225.027 | 03190014 | -0.00149694 | 0.505226 | 224.685 |
| 3 | 03190011 | 0.496862 | 0.00686699 | 221.402 | 03190010 | 0.00000 | 0.503729 | 217.207 |