| Red | Green | Blue | |
| z | 17.64 | ||
| znorm | Inf | ||
| sky | -Inf | -Inf | -Inf |
| S/N | 32.0 | 52.8 | 59.1 |
| S/N(c) | 0.0 | 0.0 | 0.0 |
| SN(E/C) |


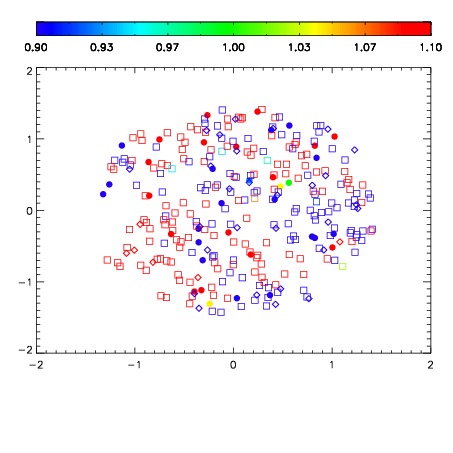
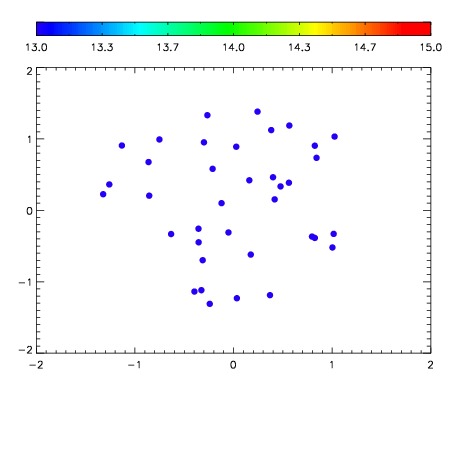

| Frame | Nreads | Zeropoints | Mag plots | Spatial mag deviation | Spatial sky 16325A emission deviations (filled: sky, open: star) | Spatial sky continuum emission | Spatial sky telluric CO2 absorption deviations (filled: H < 10) | |||||||||||||||||||||||
| 0 | 0 |
|
|
|
|
|
|
| IPAIR | NAME | SHIFT | NEWSHIFT | S/N | NAME | SHIFT | NEWSHIFT | S/N |
| 0 | 02860055 | 0.412591 | 0.00000 | 223.873 | 02860056 | 0.00180280 | 0.410788 | 224.098 |
| 1 | 02860054 | 0.411212 | 0.00137901 | 223.490 | 02860057 | 0.000860526 | 0.411730 | 221.137 |
| 2 | 02860058 | 0.411368 | 0.00122300 | 221.276 | 02860053 | 0.00000 | 0.412591 | 220.193 |
| 3 | 02860059 | 0.411673 | 0.000918001 | 216.755 | 02860060 | 0.00102927 | 0.411562 | 216.548 |