| Red | Green | Blue | |
| z | 17.64 | ||
| znorm | Inf | ||
| sky | -Inf | -Inf | -Inf |
| S/N | 28.1 | 46.9 | 49.1 |
| S/N(c) | 0.0 | 0.0 | 0.0 |
| SN(E/C) |
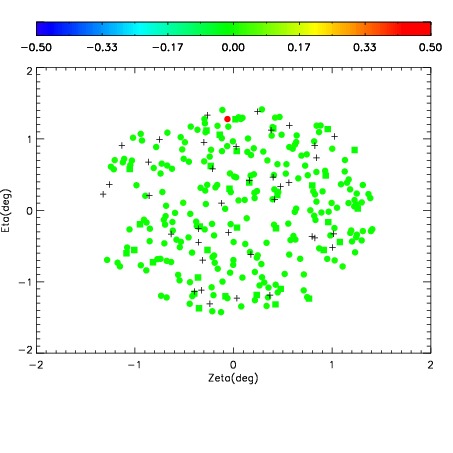
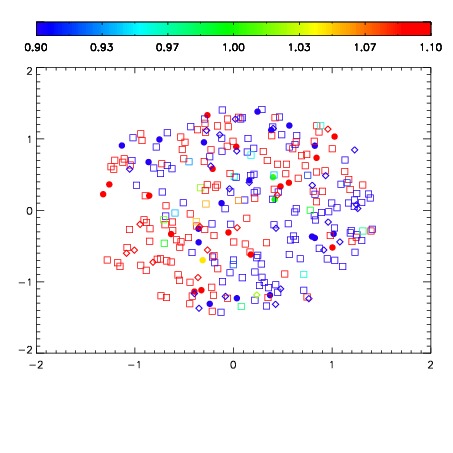
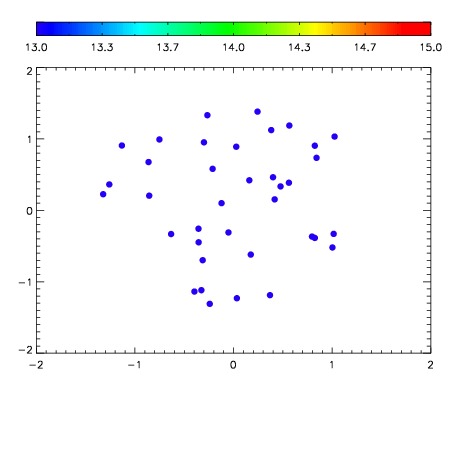

| Frame | Nreads | Zeropoints | Mag plots | Spatial mag deviation | Spatial sky 16325A emission deviations (filled: sky, open: star) | Spatial sky continuum emission | Spatial sky telluric CO2 absorption deviations (filled: H < 10) | |||||||||||||||||||||||
| 0 | 0 |
|
|
|
|
|
|
| IPAIR | NAME | SHIFT | NEWSHIFT | S/N | NAME | SHIFT | NEWSHIFT | S/N |
| 0 | 02900016 | 0.402986 | 0.00000 | 217.079 | 02900017 | 0.000911334 | 0.402075 | 182.635 |
| 1 | 02900012 | 0.401629 | 0.00135699 | 225.899 | 02900013 | 0.000728613 | 0.402257 | 225.736 |
| 2 | 02900015 | 0.402495 | 0.000490993 | 225.595 | 02900010 | 0.00000 | 0.402986 | 224.974 |
| 3 | 02900011 | 0.401305 | 0.00168100 | 224.630 | 02900014 | 0.000117450 | 0.402869 | 223.682 |