| Red | Green | Blue | |
| z | 17.64 | ||
| znorm | Inf | ||
| sky | -Inf | -Inf | -Inf |
| S/N | 17.1 | 30.9 | 34.6 |
| S/N(c) | 0.0 | 0.0 | 0.0 |
| SN(E/C) |
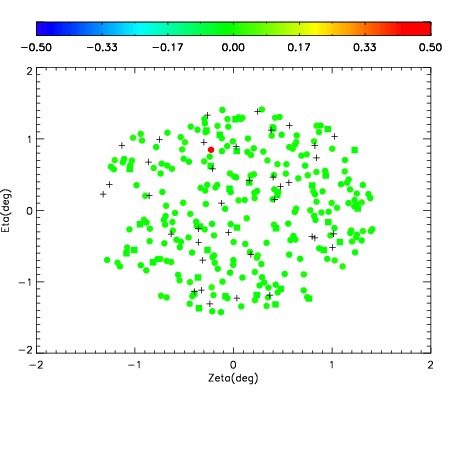
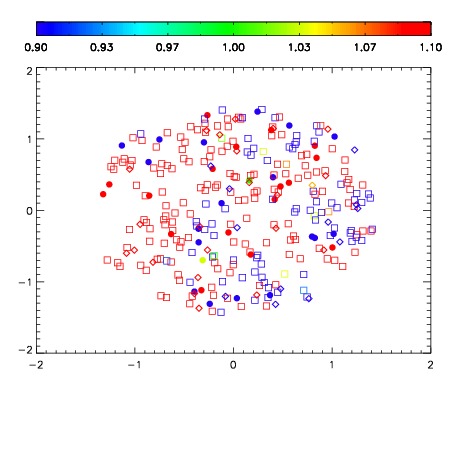
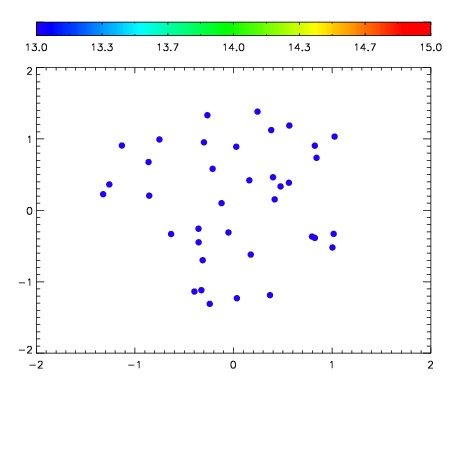

| Frame | Nreads | Zeropoints | Mag plots | Spatial mag deviation | Spatial sky 16325A emission deviations (filled: sky, open: star) | Spatial sky continuum emission | Spatial sky telluric CO2 absorption deviations (filled: H < 10) | |||||||||||||||||||||||
| 0 | 0 |
|
|
|
|
|
|
| IPAIR | NAME | SHIFT | NEWSHIFT | S/N | NAME | SHIFT | NEWSHIFT | S/N |
| 0 | 06650038 | 0.481636 | 0.00000 | 150.801 | 06650037 | 0.00000 | 0.481636 | 152.324 |
| 1 | 06650039 | 0.481359 | 0.000276983 | 158.083 | 06650044 | 0.000589413 | 0.481047 | 161.631 |
| 2 | 06650043 | 0.481099 | 0.000536978 | 141.381 | 06650040 | 0.000286329 | 0.481350 | 147.540 |
| 3 | 06650042 | 0.480318 | 0.00131798 | 134.111 | 06650041 | -3.06970e-05 | 0.481667 | 147.274 |