| Red | Green | Blue | |
| z | 17.64 | ||
| znorm | Inf | ||
| sky | -Inf | -Inf | -Inf |
| S/N | 28.1 | 49.6 | 52.6 |
| S/N(c) | 0.0 | 0.0 | 0.0 |
| SN(E/C) |

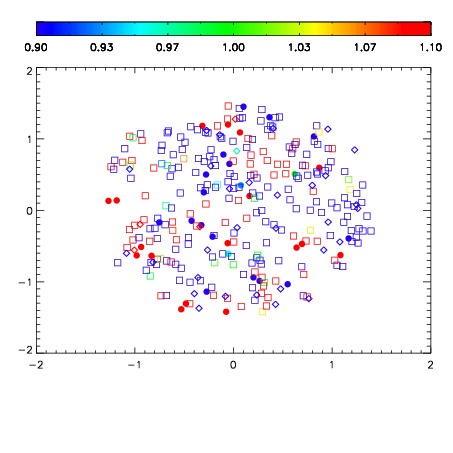
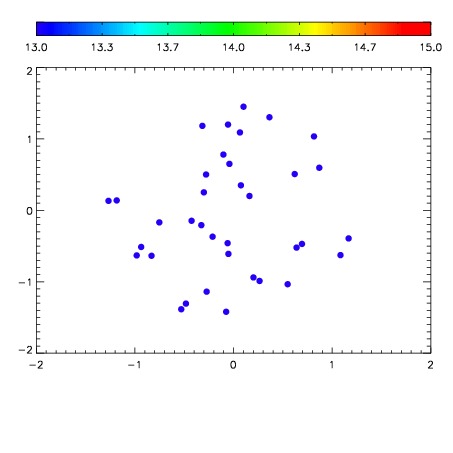

| Frame | Nreads | Zeropoints | Mag plots | Spatial mag deviation | Spatial sky 16325A emission deviations (filled: sky, open: star) | Spatial sky continuum emission | Spatial sky telluric CO2 absorption deviations (filled: H < 10) | |||||||||||||||||||||||
| 0 | 0 |
|
|
|
|
|
|
| IPAIR | NAME | SHIFT | NEWSHIFT | S/N | NAME | SHIFT | NEWSHIFT | S/N |
| 0 | 02830053 | 0.412340 | 0.00000 | 227.294 | 02830051 | -0.000861878 | 0.413202 | 231.088 |
| 1 | 02830049 | 0.411788 | 0.000551999 | 229.141 | 02830054 | 0.00223407 | 0.410106 | 235.808 |
| 2 | 02830052 | 0.409972 | 0.00236797 | 223.922 | 02830050 | 0.00200828 | 0.410332 | 227.979 |
| 3 | 02830048 | 0.410811 | 0.00152898 | 220.258 | 02830047 | 0.00000 | 0.412340 | 225.544 |