| Red | Green | Blue | |
| z | 17.64 | ||
| znorm | Inf | ||
| sky | -Inf | -NaN | -Inf |
| S/N | 25.5 | 44.6 | 49.5 |
| S/N(c) | 0.0 | 0.0 | 0.0 |
| SN(E/C) |
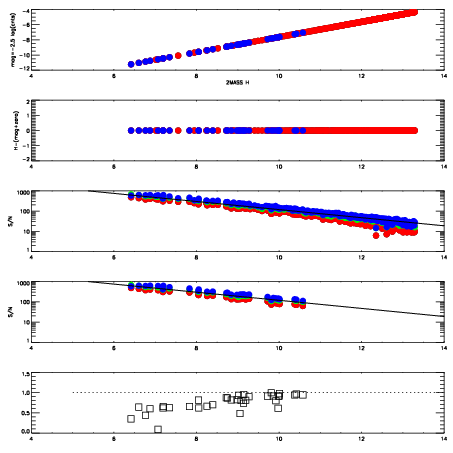
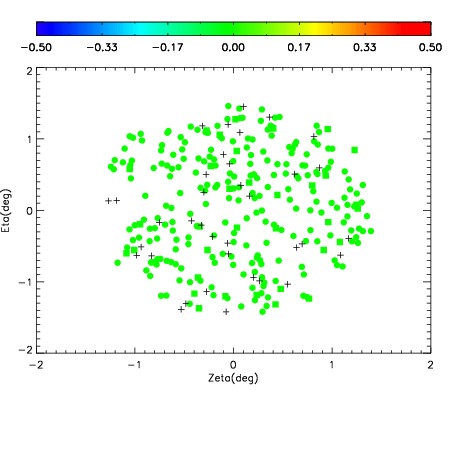
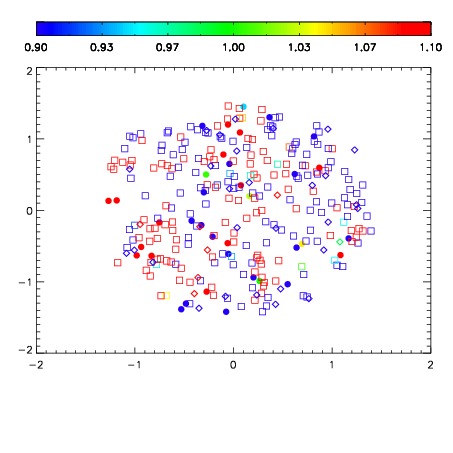
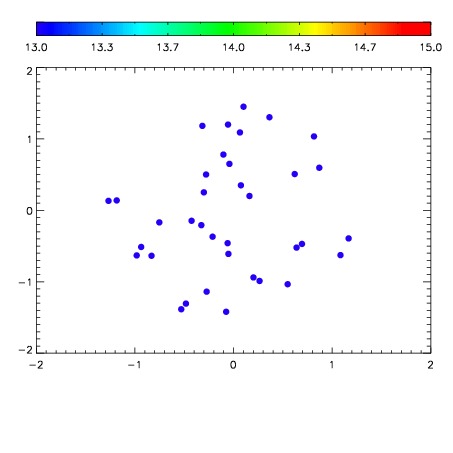

| Frame | Nreads | Zeropoints | Mag plots | Spatial mag deviation | Spatial sky 16325A emission deviations (filled: sky, open: star) | Spatial sky continuum emission | Spatial sky telluric CO2 absorption deviations (filled: H < 10) | |||||||||||||||||||||||
| 0 | 0 |
|
|
|
|
|
|
| IPAIR | NAME | SHIFT | NEWSHIFT | S/N | NAME | SHIFT | NEWSHIFT | S/N |
| 0 | 02870044 | 0.414415 | 0.00000 | 214.433 | 02870045 | 0.00173927 | 0.412676 | 211.836 |
| 1 | 02870040 | 0.410732 | 0.00368300 | 206.833 | 02870042 | 0.00108000 | 0.413335 | 205.619 |
| 2 | 02870039 | 0.407600 | 0.00681502 | 205.515 | 02870041 | 0.00207226 | 0.412343 | 204.107 |
| 3 | 02870043 | 0.413311 | 0.00110400 | 198.150 | 02870038 | 0.00000 | 0.414415 | 202.717 |