| Red | Green | Blue | |
| z | 17.64 | ||
| znorm | Inf | ||
| sky | -Inf | -NaN | -Inf |
| S/N | 15.8 | 27.6 | 32.9 |
| S/N(c) | 0.0 | 0.0 | 0.0 |
| SN(E/C) |
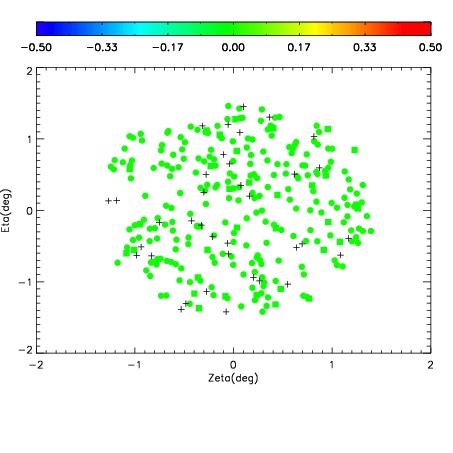
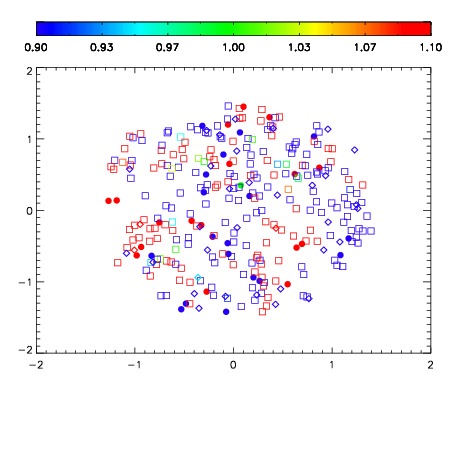
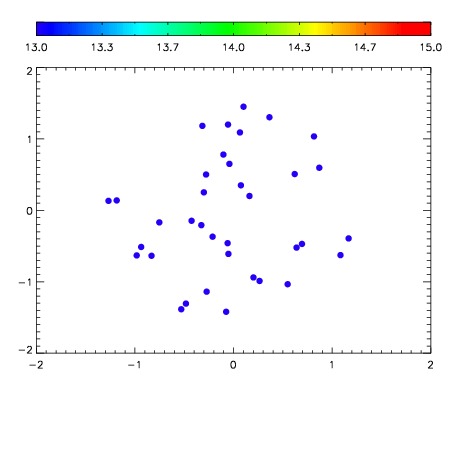

| Frame | Nreads | Zeropoints | Mag plots | Spatial mag deviation | Spatial sky 16325A emission deviations (filled: sky, open: star) | Spatial sky continuum emission | Spatial sky telluric CO2 absorption deviations (filled: H < 10) | |||||||||||||||||||||||
| 0 | 0 |
|
|
|
|
|
|
| IPAIR | NAME | SHIFT | NEWSHIFT | S/N | NAME | SHIFT | NEWSHIFT | S/N |
| 0 | 03100048 | 0.503733 | 0.00000 | 45.2370 | 03100047 | -0.000243663 | 0.503977 | 66.5709 |
| 1 | 03100044 | 0.500659 | 0.00307399 | 201.637 | 03100043 | 0.00000 | 0.503733 | 200.877 |
| 2 | 03100045 | 0.500652 | 0.00308096 | 197.258 | 03100046 | 0.00257260 | 0.501160 | 183.629 |