| Red | Green | Blue | |
| z | 17.64 | ||
| znorm | Inf | ||
| sky | -Inf | -Inf | -Inf |
| S/N | 28.0 | 49.8 | 54.8 |
| S/N(c) | 0.0 | 0.0 | 0.0 |
| SN(E/C) |
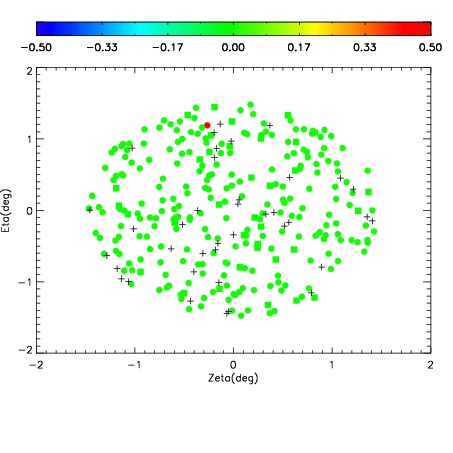
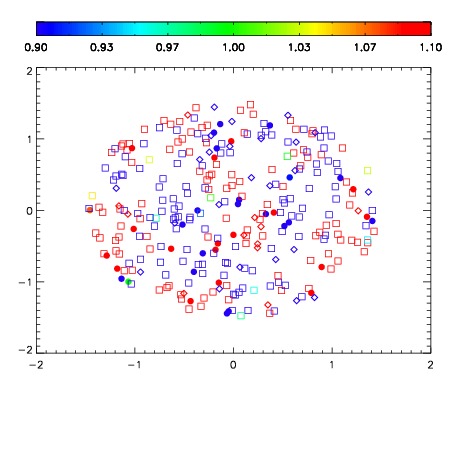
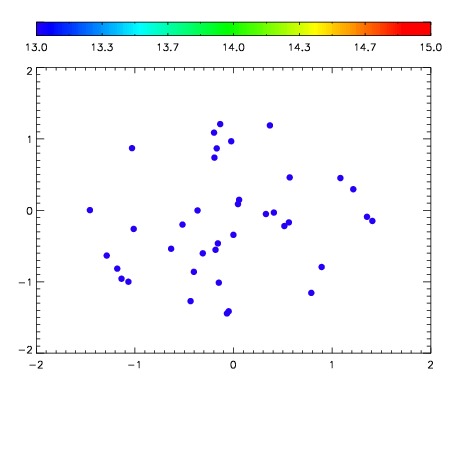

| Frame | Nreads | Zeropoints | Mag plots | Spatial mag deviation | Spatial sky 16325A emission deviations (filled: sky, open: star) | Spatial sky continuum emission | Spatial sky telluric CO2 absorption deviations (filled: H < 10) | |||||||||||||||||||||||
| 0 | 0 |
|
|
|
|
|
|
| IPAIR | NAME | SHIFT | NEWSHIFT | S/N | NAME | SHIFT | NEWSHIFT | S/N |
| 0 | 03340027 | 0.506966 | 0.00000 | 252.136 | 03340029 | -0.000128542 | 0.507095 | 245.135 |
| 1 | 03340031 | 0.506703 | 0.000262976 | 258.525 | 03340025 | 0.00000 | 0.506966 | 263.372 |
| 2 | 03340026 | 0.505719 | 0.00124699 | 258.268 | 03340032 | -0.000414437 | 0.507380 | 257.495 |
| 3 | 03340030 | 0.505796 | 0.00116998 | 257.381 | 03340028 | 0.000247549 | 0.506718 | 254.652 |