| Red | Green | Blue | |
| z | 17.64 | ||
| znorm | Inf | ||
| sky | -Inf | -Inf | -Inf |
| S/N | 29.9 | 50.4 | 55.2 |
| S/N(c) | 0.0 | 0.0 | 0.0 |
| SN(E/C) |
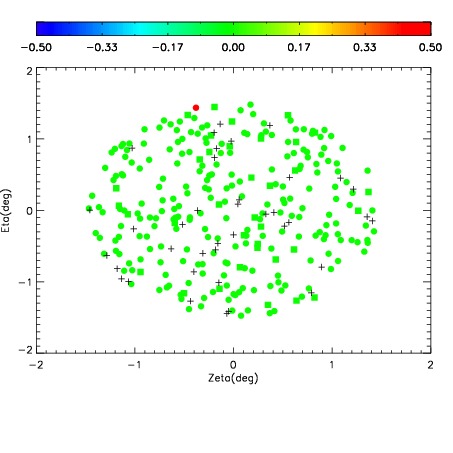
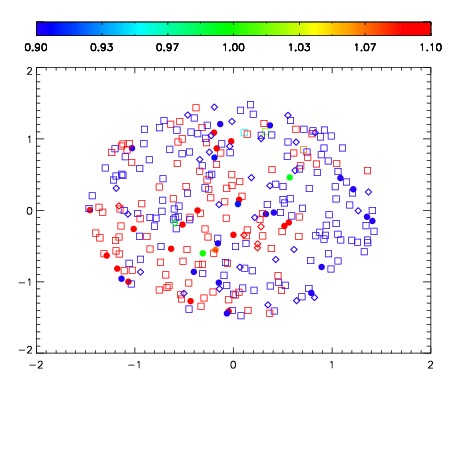
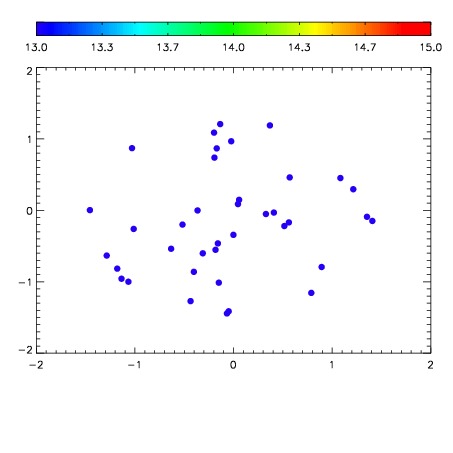

| Frame | Nreads | Zeropoints | Mag plots | Spatial mag deviation | Spatial sky 16325A emission deviations (filled: sky, open: star) | Spatial sky continuum emission | Spatial sky telluric CO2 absorption deviations (filled: H < 10) | |||||||||||||||||||||||
| 0 | 0 |
|
|
|
|
|
|
| IPAIR | NAME | SHIFT | NEWSHIFT | S/N | NAME | SHIFT | NEWSHIFT | S/N |
| 0 | 03430029 | 0.505359 | 0.00000 | 263.742 | 03430027 | 8.77642e-05 | 0.505271 | 264.792 |
| 1 | 03430024 | 0.501357 | 0.00400198 | 267.281 | 03430026 | 0.000966230 | 0.504393 | 265.757 |
| 2 | 03430025 | 0.503025 | 0.00233400 | 263.656 | 03430023 | 0.00000 | 0.505359 | 262.240 |
| 3 | 03430028 | 0.504462 | 0.000896990 | 262.901 | 03430030 | 0.00184030 | 0.503519 | 262.147 |