| Red | Green | Blue | |
| z | 17.64 | ||
| znorm | Inf | ||
| sky | -Inf | -Inf | -Inf |
| S/N | 28.2 | 49.7 | 54.3 |
| S/N(c) | 0.0 | 0.0 | 0.0 |
| SN(E/C) |
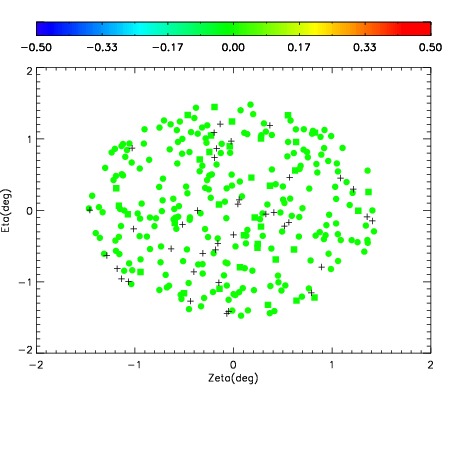
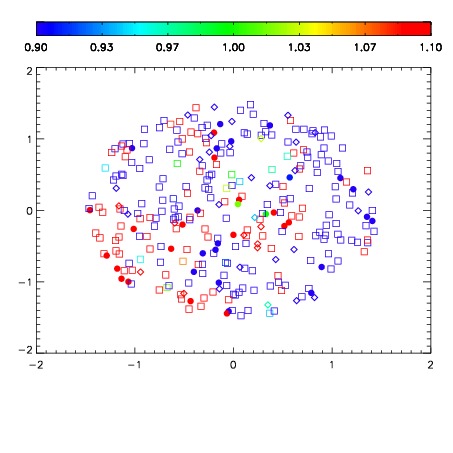
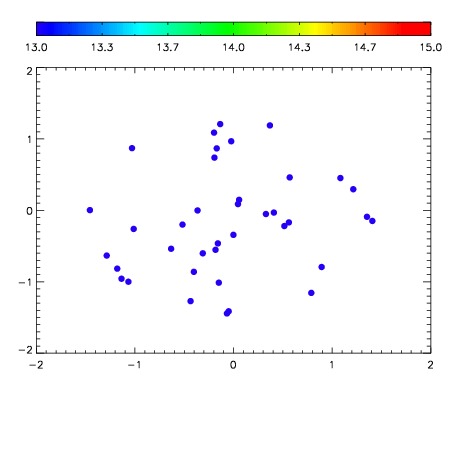

| Frame | Nreads | Zeropoints | Mag plots | Spatial mag deviation | Spatial sky 16325A emission deviations (filled: sky, open: star) | Spatial sky continuum emission | Spatial sky telluric CO2 absorption deviations (filled: H < 10) | |||||||||||||||||||||||
| 0 | 0 |
|
|
|
|
|
|
| IPAIR | NAME | SHIFT | NEWSHIFT | S/N | NAME | SHIFT | NEWSHIFT | S/N |
| 0 | 06060049 | 0.491521 | 0.00000 | 234.901 | 06060050 | 0.00315528 | 0.488366 | 242.453 |
| 1 | 06060053 | 0.489005 | 0.00251600 | 248.883 | 06060054 | 0.00340728 | 0.488114 | 248.388 |
| 2 | 06060052 | 0.488990 | 0.00253099 | 242.436 | 06060051 | 0.00178560 | 0.489735 | 242.594 |
| 3 | 06060048 | 0.490680 | 0.000840992 | 226.656 | 06060047 | 0.00000 | 0.491521 | 218.017 |