| Red | Green | Blue | |
| z | 17.64 | ||
| znorm | Inf | ||
| sky | -Inf | -Inf | -Inf |
| S/N | 15.7 | 28.7 | 30.8 |
| S/N(c) | 0.0 | 0.0 | 0.0 |
| SN(E/C) |
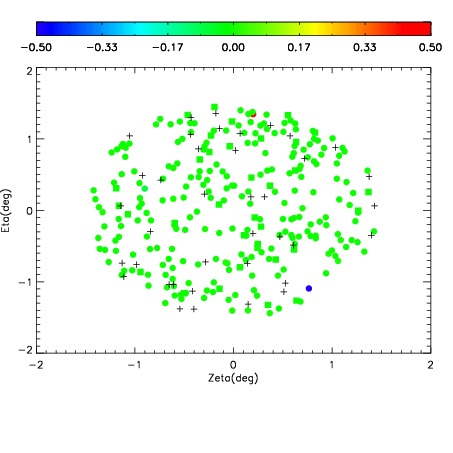
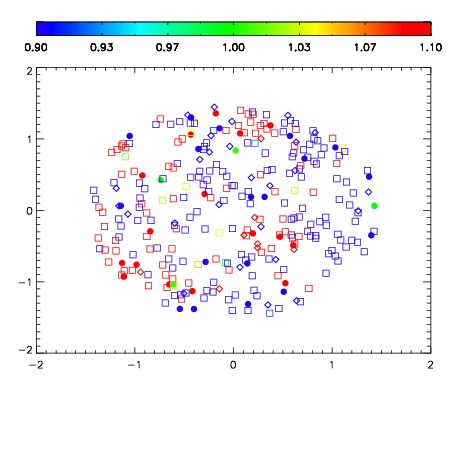
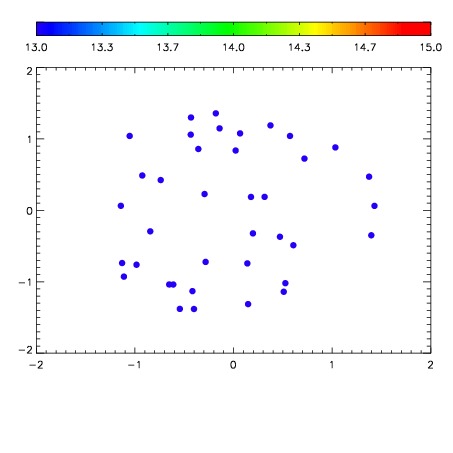

| Frame | Nreads | Zeropoints | Mag plots | Spatial mag deviation | Spatial sky 16325A emission deviations (filled: sky, open: star) | Spatial sky continuum emission | Spatial sky telluric CO2 absorption deviations (filled: H < 10) | |||||||||||||||||||||||
| 0 | 0 |
|
|
|
|
|
|
| IPAIR | NAME | SHIFT | NEWSHIFT | S/N | NAME | SHIFT | NEWSHIFT | S/N |
| 0 | 03440021 | 0.499395 | 0.00000 | 135.702 | 03440023 | -0.00319211 | 0.502587 | 107.744 |
| 1 | 03440025 | 0.499204 | 0.000191003 | 192.038 | 03440019 | 0.00000 | 0.499395 | 238.828 |
| 2 | 03440020 | 0.498573 | 0.000822008 | 172.125 | 03440026 | -0.00245475 | 0.501850 | 160.333 |
| 3 | 03440024 | 0.497422 | 0.00197300 | 160.630 | 03440022 | 0.000967002 | 0.498428 | 132.578 |