| Red | Green | Blue | |
| z | 17.64 | ||
| znorm | Inf | ||
| sky | -Inf | -Inf | -Inf |
| S/N | 29.7 | 51.3 | 54.9 |
| S/N(c) | 0.0 | 0.0 | 0.0 |
| SN(E/C) |
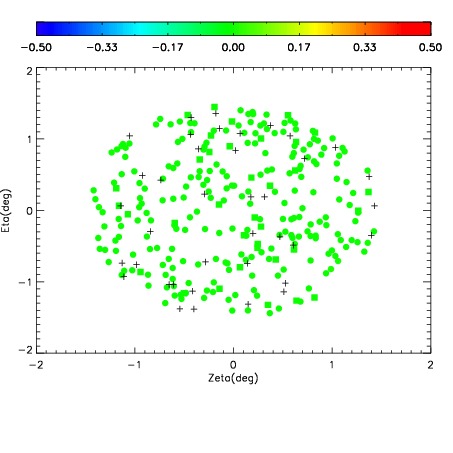
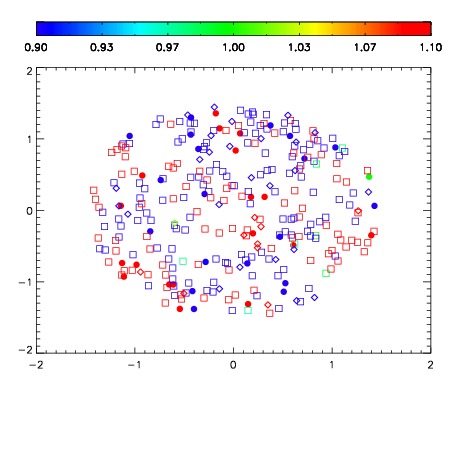
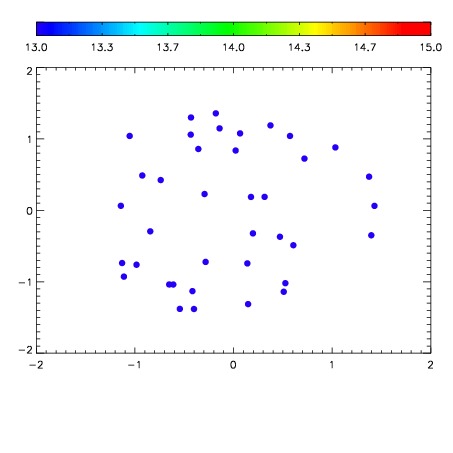

| Frame | Nreads | Zeropoints | Mag plots | Spatial mag deviation | Spatial sky 16325A emission deviations (filled: sky, open: star) | Spatial sky continuum emission | Spatial sky telluric CO2 absorption deviations (filled: H < 10) | |||||||||||||||||||||||
| 0 | 0 |
|
|
|
|
|
|
| IPAIR | NAME | SHIFT | NEWSHIFT | S/N | NAME | SHIFT | NEWSHIFT | S/N |
| 0 | 06430041 | 0.482967 | 0.00000 | 251.774 | 06430036 | 0.00000 | 0.482967 | 255.080 |
| 1 | 06430037 | 0.481309 | 0.00165799 | 251.735 | 06430040 | -0.00148160 | 0.484449 | 253.866 |
| 2 | 06430038 | 0.481134 | 0.00183299 | 250.352 | 06430039 | -0.000159985 | 0.483127 | 251.574 |
| 3 | 06430042 | 0.482792 | 0.000174999 | 249.819 | 06430043 | -0.000597636 | 0.483565 | 248.747 |