| Red | Green | Blue | |
| z | 17.64 | ||
| znorm | Inf | ||
| sky | -Inf | -Inf | -Inf |
| S/N | 19.8 | 35.7 | 38.1 |
| S/N(c) | 0.0 | 0.0 | 0.0 |
| SN(E/C) |
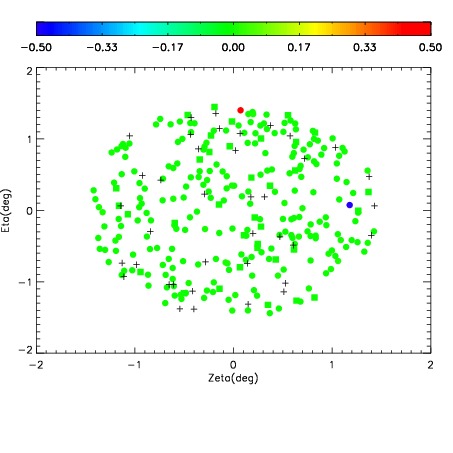
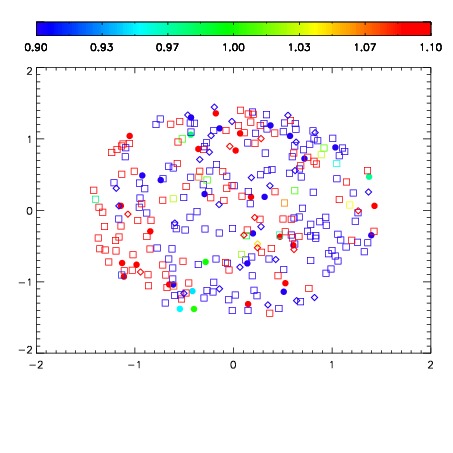
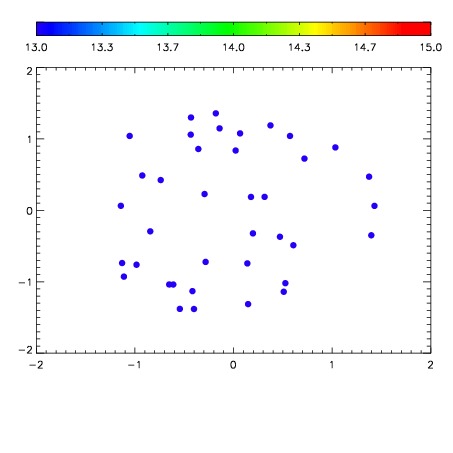

| Frame | Nreads | Zeropoints | Mag plots | Spatial mag deviation | Spatial sky 16325A emission deviations (filled: sky, open: star) | Spatial sky continuum emission | Spatial sky telluric CO2 absorption deviations (filled: H < 10) | |||||||||||||||||||||||
| 0 | 0 |
|
|
|
|
|
|
| IPAIR | NAME | SHIFT | NEWSHIFT | S/N | NAME | SHIFT | NEWSHIFT | S/N |
| 0 | 06620044 | 0.483981 | 0.00000 | 234.733 | 06620046 | 0.00208026 | 0.481901 | 241.425 |
| 1 | 06620045 | 0.483962 | 1.90139e-05 | 232.316 | 06620047 | 0.00176209 | 0.482219 | 238.250 |
| 2 | 06620048 | 0.481687 | 0.00229400 | 193.529 | 06620043 | 0.00000 | 0.483981 | 204.867 |