| Red | Green | Blue | |
| z | 17.64 | ||
| znorm | Inf | ||
| sky | -Inf | -Inf | -Inf |
| S/N | 27.6 | 48.0 | 50.7 |
| S/N(c) | 0.0 | 0.0 | 0.0 |
| SN(E/C) |
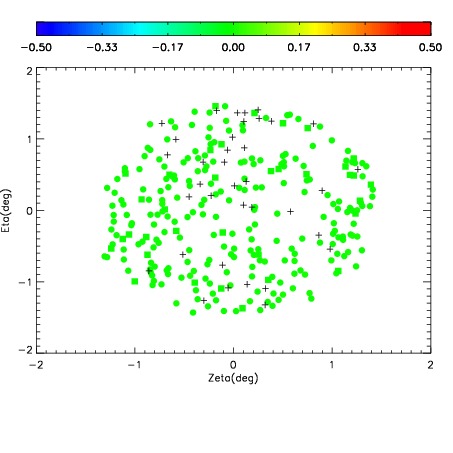
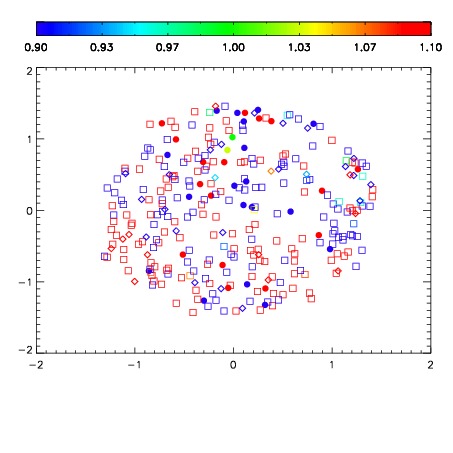
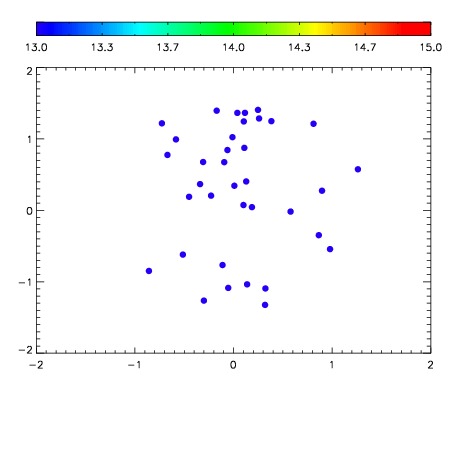

| Frame | Nreads | Zeropoints | Mag plots | Spatial mag deviation | Spatial sky 16325A emission deviations (filled: sky, open: star) | Spatial sky continuum emission | Spatial sky telluric CO2 absorption deviations (filled: H < 10) | |||||||||||||||||||||||
| 0 | 0 |
|
|
|
|
|
|
| IPAIR | NAME | SHIFT | NEWSHIFT | S/N | NAME | SHIFT | NEWSHIFT | S/N |
| 0 | 02890051 | 0.403354 | 0.00000 | 254.406 | 02890056 | -9.62850e-05 | 0.403450 | 248.995 |
| 1 | 02890055 | 0.399211 | 0.00414300 | 255.855 | 02890052 | -0.00217976 | 0.405534 | 251.086 |
| 2 | 02890054 | 0.397219 | 0.00613499 | 254.786 | 02890049 | 0.00000 | 0.403354 | 250.832 |
| 3 | 02890050 | 0.401580 | 0.00177398 | 252.224 | 02890053 | -0.00229200 | 0.405646 | 241.936 |