| Red | Green | Blue | |
| z | 17.64 | ||
| znorm | Inf | ||
| sky | -Inf | -Inf | -Inf |
| S/N | 22.2 | 39.1 | 42.1 |
| S/N(c) | 0.0 | 0.0 | 0.0 |
| SN(E/C) |
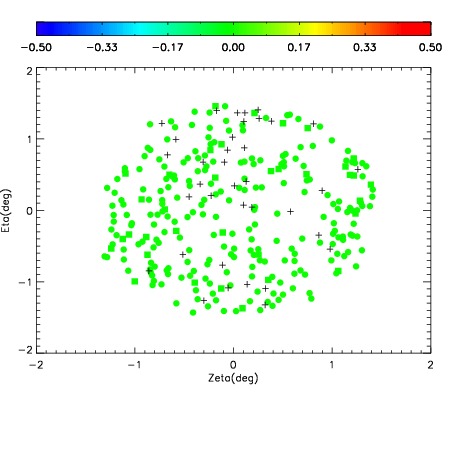
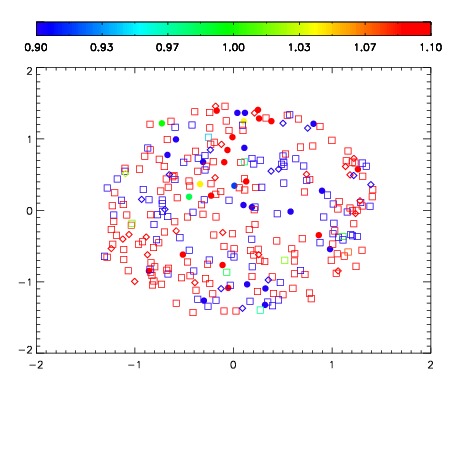
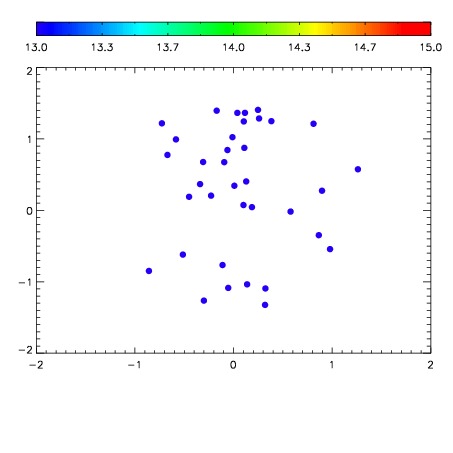

| Frame | Nreads | Zeropoints | Mag plots | Spatial mag deviation | Spatial sky 16325A emission deviations (filled: sky, open: star) | Spatial sky continuum emission | Spatial sky telluric CO2 absorption deviations (filled: H < 10) | |||||||||||||||||||||||
| 0 | 0 |
|
|
|
|
|
|
| IPAIR | NAME | SHIFT | NEWSHIFT | S/N | NAME | SHIFT | NEWSHIFT | S/N |
| 0 | 03070036 | 0.500071 | 0.00000 | 231.888 | 03070037 | -0.00130141 | 0.501372 | 202.553 |
| 1 | 03070035 | 0.499404 | 0.000666976 | 244.986 | 03070034 | 0.00000 | 0.500071 | 241.710 |
| 2 | 03070039 | 0.498896 | 0.00117499 | 202.019 | 03070038 | -0.00313233 | 0.503203 | 193.007 |
| 3 | 03070040 | 0.498641 | 0.00142998 | 186.972 | 03070041 | 0.00104975 | 0.499021 | 107.185 |