| Red | Green | Blue | |
| z | 17.64 | ||
| znorm | Inf | ||
| sky | -NaN | -Inf | -Inf |
| S/N | 29.8 | 51.5 | 54.1 |
| S/N(c) | 0.0 | 0.0 | 0.0 |
| SN(E/C) |
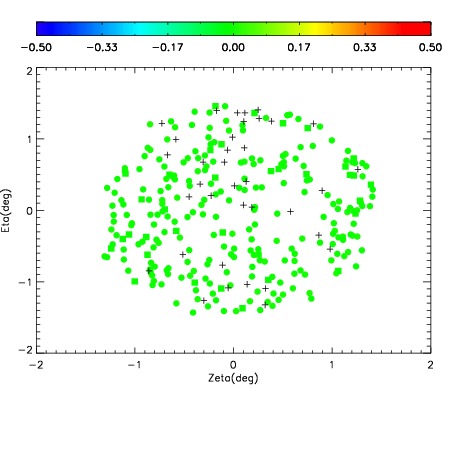
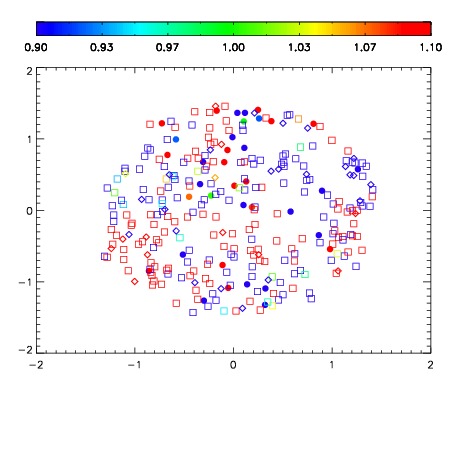
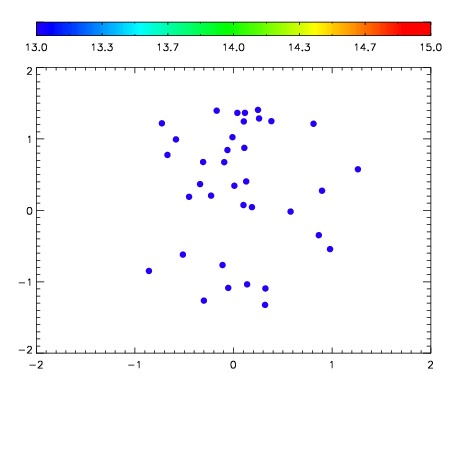

| Frame | Nreads | Zeropoints | Mag plots | Spatial mag deviation | Spatial sky 16325A emission deviations (filled: sky, open: star) | Spatial sky continuum emission | Spatial sky telluric CO2 absorption deviations (filled: H < 10) | |||||||||||||||||||||||
| 0 | 0 |
|
|
|
|
|
|
| IPAIR | NAME | SHIFT | NEWSHIFT | S/N | NAME | SHIFT | NEWSHIFT | S/N |
| 0 | 06110060 | 0.486411 | 0.00000 | 252.773 | 06110058 | 0.00000 | 0.486411 | 251.053 |
| 1 | 06110059 | 0.486271 | 0.000140011 | 252.831 | 06110062 | -0.000134731 | 0.486546 | 252.251 |
| 2 | 06110063 | 0.485279 | 0.00113201 | 251.731 | 06110065 | -1.60791e-05 | 0.486427 | 250.229 |
| 3 | 06110064 | 0.486110 | 0.000301003 | 250.178 | 06110061 | 0.00154929 | 0.484862 | 249.056 |