| Red | Green | Blue | |
| z | 17.64 | ||
| znorm | Inf | ||
| sky | -Inf | -Inf | -Inf |
| S/N | 23.1 | 41.3 | 47.0 |
| S/N(c) | 0.0 | 0.0 | 0.0 |
| SN(E/C) |
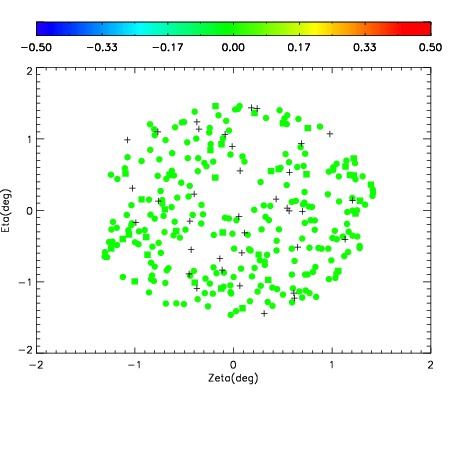
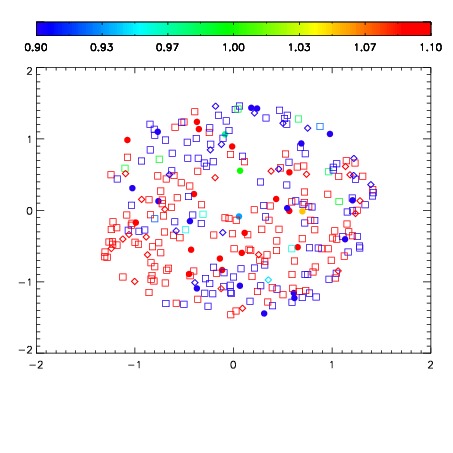
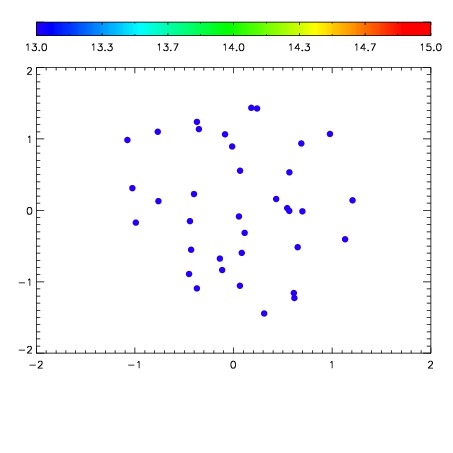

| Frame | Nreads | Zeropoints | Mag plots | Spatial mag deviation | Spatial sky 16325A emission deviations (filled: sky, open: star) | Spatial sky continuum emission | Spatial sky telluric CO2 absorption deviations (filled: H < 10) | |||||||||||||||||||||||
| 0 | 0 |
|
|
|
|
|
|
| IPAIR | NAME | SHIFT | NEWSHIFT | S/N | NAME | SHIFT | NEWSHIFT | S/N |
| 0 | 03090036 | 0.494926 | 0.00000 | 165.996 | 03090038 | 0.00469262 | 0.490233 | 165.635 |
| 1 | 03090035 | 0.494640 | 0.000286013 | 169.164 | 03090041 | 0.00648602 | 0.488440 | 166.280 |
| 2 | 03090040 | 0.492321 | 0.00260499 | 164.054 | 03090037 | 0.00776602 | 0.487160 | 163.645 |
| 3 | 03090039 | 0.492280 | 0.00264600 | 162.095 | 03090034 | 0.00000 | 0.494926 | 161.399 |