| Red | Green | Blue | |
| z | 17.64 | ||
| znorm | Inf | ||
| sky | -Inf | -Inf | -Inf |
| S/N | 22.2 | 40.1 | 48.5 |
| S/N(c) | 0.0 | 0.0 | 0.0 |
| SN(E/C) |
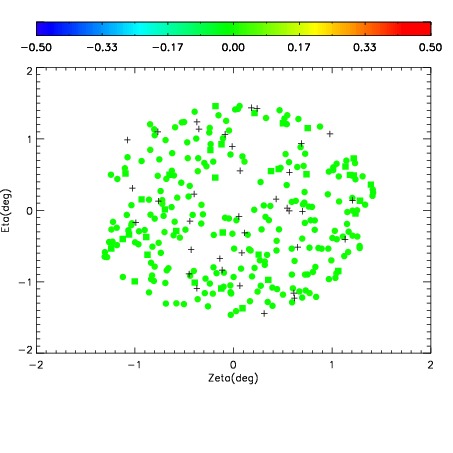
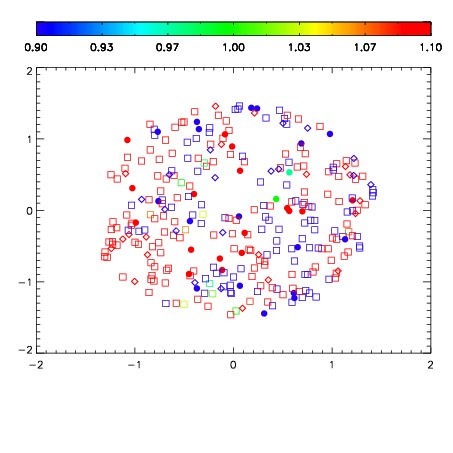


| Frame | Nreads | Zeropoints | Mag plots | Spatial mag deviation | Spatial sky 16325A emission deviations (filled: sky, open: star) | Spatial sky continuum emission | Spatial sky telluric CO2 absorption deviations (filled: H < 10) | |||||||||||||||||||||||
| 0 | 0 |
|
|
|
|
|
|
| IPAIR | NAME | SHIFT | NEWSHIFT | S/N | NAME | SHIFT | NEWSHIFT | S/N |
| 0 | 06420046 | 0.483048 | 0.00000 | 189.951 | 06420051 | 0.00277394 | 0.480274 | 191.850 |
| 1 | 06420050 | 0.482617 | 0.000431001 | 174.329 | 06420048 | -0.000340912 | 0.483389 | 187.675 |
| 2 | 06420049 | 0.482173 | 0.000874996 | 174.291 | 06420047 | 0.000459135 | 0.482589 | 185.059 |
| 3 | 06420045 | 0.482761 | 0.000286996 | 165.627 | 06420044 | 0.00000 | 0.483048 | 144.901 |