| Red | Green | Blue | |
| z | 17.64 | ||
| znorm | Inf | ||
| sky | -Inf | -Inf | -Inf |
| S/N | 20.3 | 36.1 | 40.8 |
| S/N(c) | 0.0 | 0.0 | 0.0 |
| SN(E/C) |
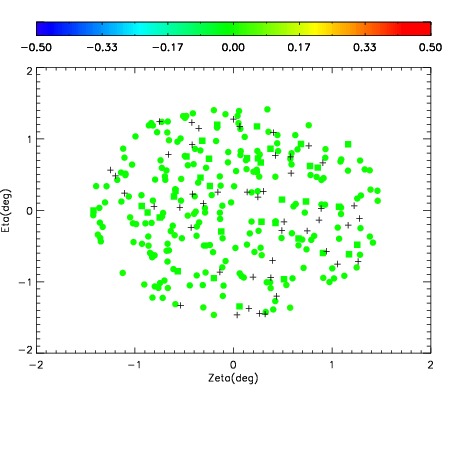
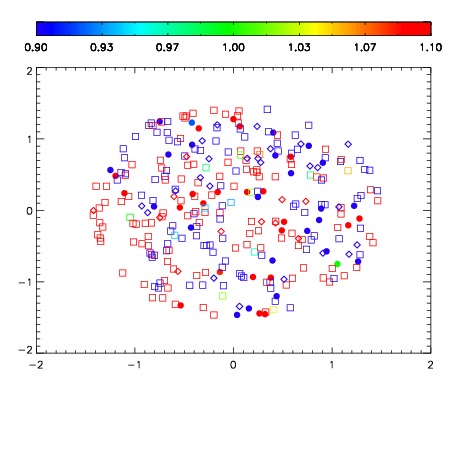


| Frame | Nreads | Zeropoints | Mag plots | Spatial mag deviation | Spatial sky 16325A emission deviations (filled: sky, open: star) | Spatial sky continuum emission | Spatial sky telluric CO2 absorption deviations (filled: H < 10) | |||||||||||||||||||||||
| 0 | 0 |
|
|
|
|
|
|
| IPAIR | NAME | SHIFT | NEWSHIFT | S/N | NAME | SHIFT | NEWSHIFT | S/N |
| 0 | 02620053 | 0.423836 | 0.00000 | 147.781 | 02620055 | -0.00149688 | 0.425333 | 214.411 |
| 1 | 02620057 | 0.423399 | 0.000436991 | 226.500 | 02620054 | -0.000787893 | 0.424624 | 224.461 |
| 2 | 02620056 | 0.422444 | 0.00139201 | 211.047 | 02620058 | -0.000200552 | 0.424037 | 221.283 |
| 3 | 02620052 | 0.422396 | 0.00143999 | 49.0400 | 02620051 | 0.00000 | 0.423836 | 170.915 |