| Red | Green | Blue | |
| z | 17.64 | ||
| znorm | Inf | ||
| sky | -Inf | -Inf | -Inf |
| S/N | 29.8 | 50.9 | 54.4 |
| S/N(c) | 0.0 | 0.0 | 0.0 |
| SN(E/C) |
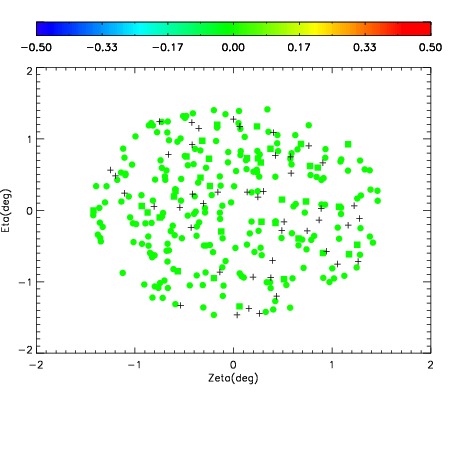
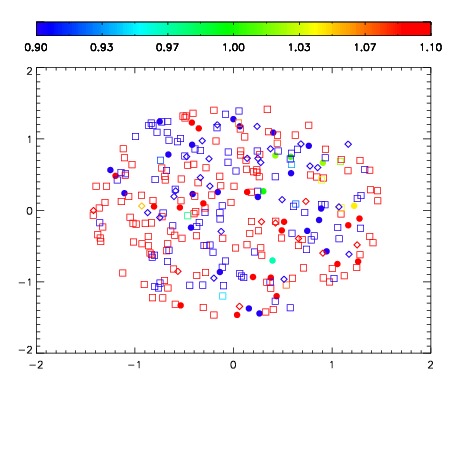
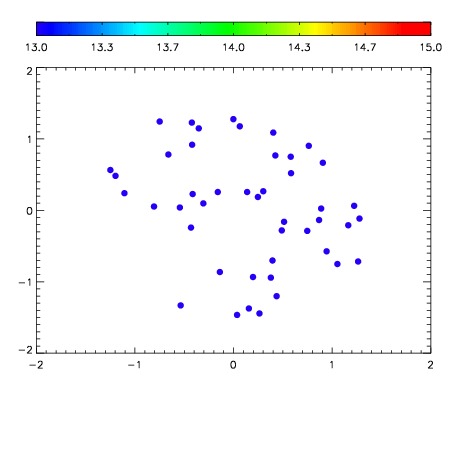

| Frame | Nreads | Zeropoints | Mag plots | Spatial mag deviation | Spatial sky 16325A emission deviations (filled: sky, open: star) | Spatial sky continuum emission | Spatial sky telluric CO2 absorption deviations (filled: H < 10) | |||||||||||||||||||||||
| 0 | 0 |
|
|
|
|
|
|
| IPAIR | NAME | SHIFT | NEWSHIFT | S/N | NAME | SHIFT | NEWSHIFT | S/N |
| 0 | 03190040 | 0.507040 | 0.00000 | 233.404 | 03190041 | 0.00234861 | 0.504691 | 235.318 |
| 1 | 03190035 | 0.501875 | 0.00516504 | 244.678 | 03190037 | 0.00225612 | 0.504784 | 246.714 |
| 2 | 03190036 | 0.504005 | 0.00303501 | 241.447 | 03190034 | 0.00000 | 0.507040 | 244.967 |
| 3 | 03190039 | 0.498295 | 0.00874501 | 237.382 | 03190038 | 0.00399641 | 0.503044 | 242.375 |